欢迎使用CSDN-markdown编辑器
目录
geoserver 热图开发流程
简介:热力图采用PostGis数据库存储地图和人流点数据,通过Geoserver服务发布,前端采用OpenLayers引入并展现完成。
开发流程图
详细说明
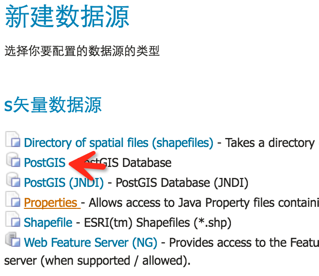
Postgis数据准备
the_geom用于存储坐标信息
企业客户地图:庞博提供
Postgis shapFile 文件
人流定位数据:孙科提供
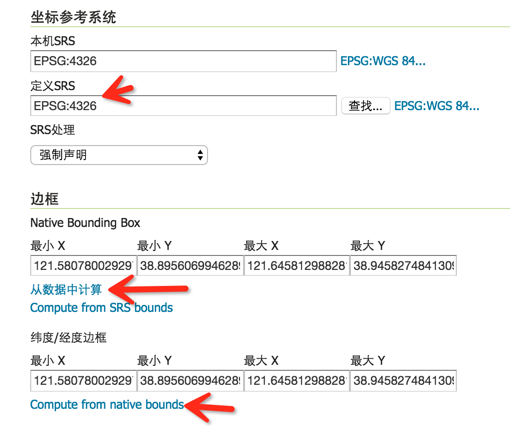
存入Postgis,坐标系:EPSG:4326 该表只存储5分钟内的定位数据,每5分钟刷新一次,并删除之前5分钟的数据
表示例:
| id | province_id | city_id | enterprise | building | floor | the_geom | postion_time |
|---|---|---|---|---|---|---|---|
| 1 | 116 | 11602 | zhongshanyiyuan | ZS1 | F1 | 0101000020E6100000000000C0E9D369410000000028F75141 | 2016-08-08 10:00:00 |
AP点位数据
存入Postgis,坐标系:EPSG:4326
表示例:
| ft_id | by | fl_id | ft_name_cn | ft_name_en | ft_type | py_type | c_time | u_time | u_flag | the_geom |
|---|---|---|---|---|---|---|---|---|---|---|
| ZH0000110100100001 | XH1-B1-AP-001 | 0101000020E61000001C29C7744A655E405CC51EBF08794340 |
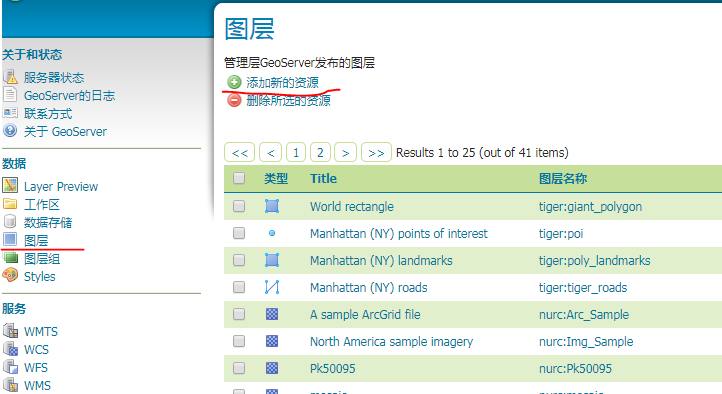
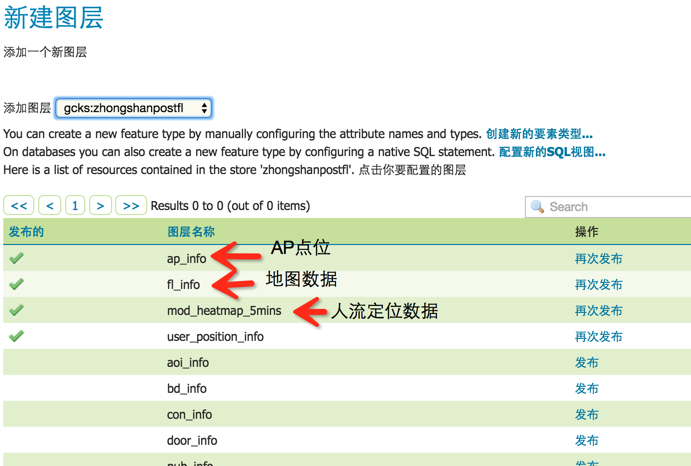
新建Geoserver图层


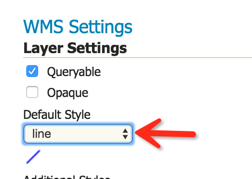
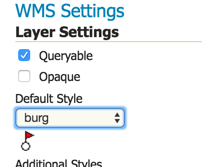
发布WMS服务 style sld
发布地图

发布AP点位

发布人流热图


热图样式设置
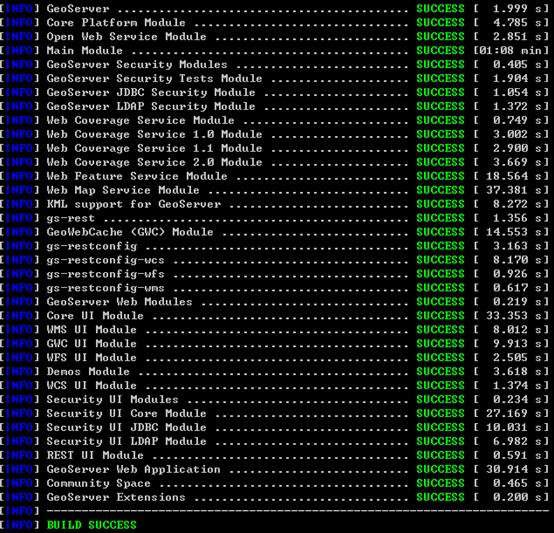
一 环境部署
正常部署geoserver,本次版本是2.6
下载地址:http://geoserver.org/release/stable/
另外要下载
Extensions的wps扩展插件。
解压wps,将jar包放进geoserver部署的web-INF/lib中,重启geoserver。二 生成热力图的样式文件heatmap.sld
<?xml version="1.0" encoding="ISO-8859-1"?>
   <StyledLayerDescriptor version="1.0.0"
       xsi:schemaLocation="http://www.opengis.net/sld StyledLayerDescriptor.xsd"
       xmlns="http://www.opengis.net/sld"
       xmlns:ogc="http://www.opengis.net/ogc"
       xmlns:xlink="http://www.w3.org/1999/xlink"
       xmlns:xsi="http://www.w3.org/2001/XMLSchema-instance">
     <NamedLayer>
       <Name>Heatmap</Name>
       <UserStyle>
         <Title>Heatmap</Title>
         <Abstract>A heatmap surface showing population density</Abstract>
         <FeatureTypeStyle>
           <Transformation>
             <ogc:Function name="gs:Heatmap">
               <ogc:Function name="parameter">
                 <ogc:Literal>data</ogc:Literal>
               </ogc:Function>
               <ogc:Function name="parameter">
                 <ogc:Literal>weightAttr</ogc:Literal>
                 <ogc:Literal>jan_je</ogc:Literal>
               </ogc:Function>
               <ogc:Function name="parameter">
                 <ogc:Literal>radiusPixels</ogc:Literal>
                 <ogc:Function name="env">
                   <ogc:Literal>radius</ogc:Literal>
                   <ogc:Literal>100</ogc:Literal>
                 </ogc:Function>
               </ogc:Function>
               <ogc:Function name="parameter">
                 <ogc:Literal>pixelsPerCell</ogc:Literal>
                 <ogc:Literal>10</ogc:Literal>
               </ogc:Function>
               <ogc:Function name="parameter">
                 <ogc:Literal>outputBBOX</ogc:Literal>
                 <ogc:Function name="env">
                   <ogc:Literal>wms_bbox</ogc:Literal>
                 </ogc:Function>
               </ogc:Function>
               <ogc:Function name="parameter">
                 <ogc:Literal>outputWidth</ogc:Literal>
                 <ogc:Function name="env">
                   <ogc:Literal>wms_width</ogc:Literal>
                 </ogc:Function>
               </ogc:Function>
               <ogc:Function name="parameter">
                 <ogc:Literal>outputHeight</ogc:Literal>
                 <ogc:Function name="env">
                   <ogc:Literal>wms_height</ogc:Literal>
                 </ogc:Function>
               </ogc:Function>
             </ogc:Function>
           </Transformation>
          <Rule>
            <RasterSymbolizer>
            <!-- specify geometry attribute to pass validation -->
              <Geometry>
                <ogc:PropertyName>geom</ogc:PropertyName></Geometry>
              <Opacity>0.6</Opacity>
                <ColorMap type="ramp" >
                <ColorMapEntry color="#0000FF" quantity="0" label="nodata" opacity="0"/>
                <ColorMapEntry color="#00FFFF" quantity="0.02" label="nodata"
                  opacity="0"/>
                <ColorMapEntry color="#00FF00" quantity=".1" label="nodata"/>
                <ColorMapEntry color="#FFFF00" quantity=".5" label="values" />
                <ColorMapEntry color="#FF0000" quantity="1.0" label="values" />
              </ColorMap>
            </RasterSymbolizer>
           </Rule>
         </FeatureTypeStyle>
       </UserStyle>
     </NamedLayer>
    </StyledLayerDescriptor>
weightAttr标签指定权重字段,在这里我设置weightAttrz权重字段名称为jan_je。colormap中的热力图符号和范围设置,也是可以改和设置的。
而<ogc:PropertyName>geom</ogc:PropertyName></Geometry>这里是指定渲染的图形字段,查看数据库空间数据表的图形字段名称,如果是geom就写geom,如果是the_geom就写the_geom,根据自己数据库中图形字段名称来。在geoserver>style中发布这样的一个sld文件。
Openlayers装载图层
 var baseServer = "http://geoserver地址/geoserver/gcks/wms";
    var map = new ol.Map({
        target: 'map',
        layers: [
            new ol.layer.Tile({
                source: new ol.source.OSM()
            })
        ],
        view: new ol.View({
            projection: 'EPSG:900913',
            center: [13541202.790897895,4709549.109971935],
            zoom: 19
        })
    });
    //人流定位数据图层
var layer1 = new ol.layer.Image({
        visible: true,
        source: new ol.source.ImageWMS({
            ratio: 1,
            url: baseServer,
            serverType: "geoserver",
            params: {
                FORMAT: 'image/png',
                VERSION: '1.1.0',
                LAYERS: 'gcks:mod_heatmap_5mins',
                STYLES: ''
            }
        })
    });
    //地图数据图层
    var layer2 = new ol.layer.Image({
        visible: true,
        source: new ol.source.ImageWMS({
            ratio: 1,
            url: baseServer,
            serverType: "geoserver",
            params: {
                FORMAT: 'image/png',
                VERSION: '1.1.0',
                LAYERS: 'gcks:fl_info_1',
                STYLES: ''
            }
        })
    });
    map.addLayer(layer1);
    map.addLayer(layer2);
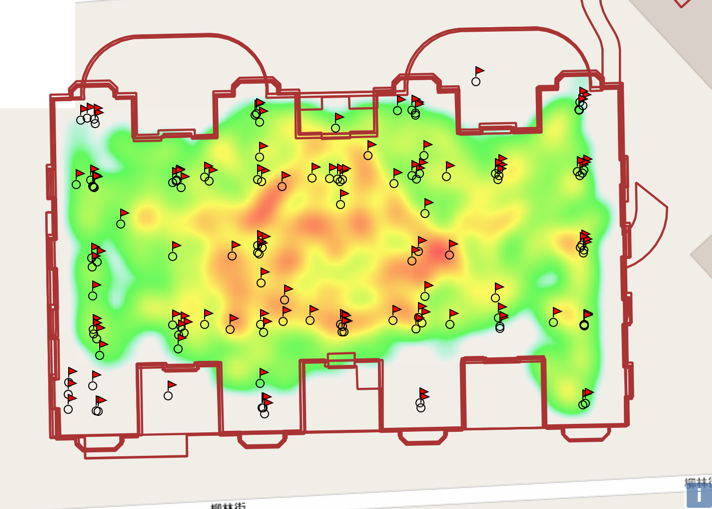
最终展示效果:

转载自:https://blog.csdn.net/lichengbei100/article/details/52164346