Openlayers3 加载Geowebcache 发布的 ArcGIS 切片地图
上篇 使用Geoserver(其实是Geowebcache) 发布本地的ArcGIS 切片地图, 成功发布了ArcGIS 的切片地图,本篇介绍使用 OpenLayers 加载 Geowebcache 发布的wms服务。
openlayes版本 :3.13.1
geowebcache: 1.10.0
代码如下:
<!DOCTYPE html>
<html lang="en">
<head>
<meta charset="UTF-8">
<title>Title</title>
<link rel="stylesheet" type="text/css" href="./libs/ol3.13.1/ol.css" />
<style type="text/css">
/* 鼠标位置控件层样式设置 */
#mouse-position {
float: left;
position: absolute;
bottom: 5px;
width: 500px;
height: 20px;
/*在地图容器中的层,要设置z-index的值让其显示在地图上层*/
z-index: 2000;
}
/* 鼠标位置信息自定义样式设置 */
.custom-mouse-position {
color: rgb(0,0,0);
font-size: 16px;
font-family: "微软雅黑";
}
</style>
</head>
<body>
<div id="map">
<div id="mouse-position">
</div>
</div>
</body>
<script src="libs/ol3.13.1/ol-debug.js"></script>
<script src="./libs/jquery-3.1.0.min.js"></script>
<script type="text/javascript">
//实例化鼠标位置控件(MousePosition)
var mousePositionControl = new ol.control.MousePosition({
//坐标格式
coordinateFormat: ol.coordinate.createStringXY(4),
//地图投影坐标系(若未设置则输出为默认投影坐标系下的坐标)
projection: 'EPSG:3857',
//坐标信息显示样式类名,默认是'ol-mouse-position'
className: 'custom-mouse-position',
//显示鼠标位置信息的目标容器
target: document.getElementById('mouse-position'),
//未定义坐标的标记
undefinedHTML: ' '
});
var pos = ol.proj.get('EPSG:3857');
var map=new ol.Map({
//地图容器div的ID
target: 'map',
//地图容器中加载的图层
layers: [
// new ol.layer.Tile({
// source: new ol.source.OSM()
// })
],
view: new ol.View({
//设置地图投影坐标系
projection: pos,
center: [133135942.5127,4932500.5445],
zoom:10
}),
//加载控件到地图容器中
controls: ol.control.defaults({
/* @type {ol.control.Attribution} */
attributionOptions: ({
//地图数据源信息控件是否可收缩,默认为true
collapsible: true
})
}).extend([mousePositionControl])//加载鼠标位置控件
});
var layer=new ol.layer.Tile({
source:new ol.source.TileWMS({
url:'http://localhost:8081/geowebcache/service/wms',
params:{
'LAYERS':'test1',
'FORMAT':'image/png',
'SRS':'EPSG:3857'
},
tileGrid:new ol.tilegrid.TileGrid({
resolutions:[156543.03392800014,
78271.51696399994,
39135.75848200009,
19567.87924099992,
9783.93962049996,
4891.96981024998,
2445.98490512499,
1222.992452562495,
611.4962262813797,
305.74811314055756,
152.87405657041106,
76.43702828507324,
38.21851414253662,
19.10925707126831,
9.554628535634155,
4.77731426794937,
2.388657133974685,
1.1943285668550503,
0.5971642835598172,
0.29858214164761665],
origin:[-20037508.342787001, 20037508.342787001]
})
})
})
map.addLayer(layer);
</script>
</html>需要注意的是:
params中对应 切片地图的 名称,格式和参考系统,
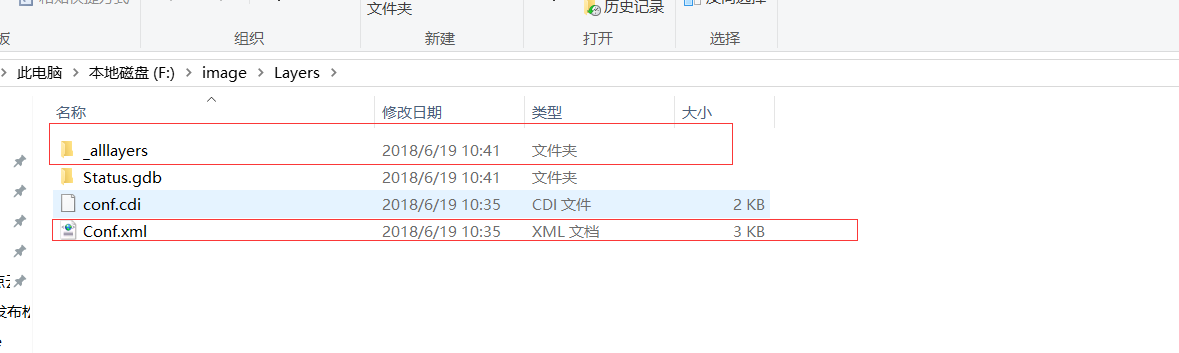
其中resolutions 和 origin 对应的范围在 arcgis 切片目录下 con.xml 配置文件中可以找到。
参考系统不对,或范围格式不对可能出不了图。
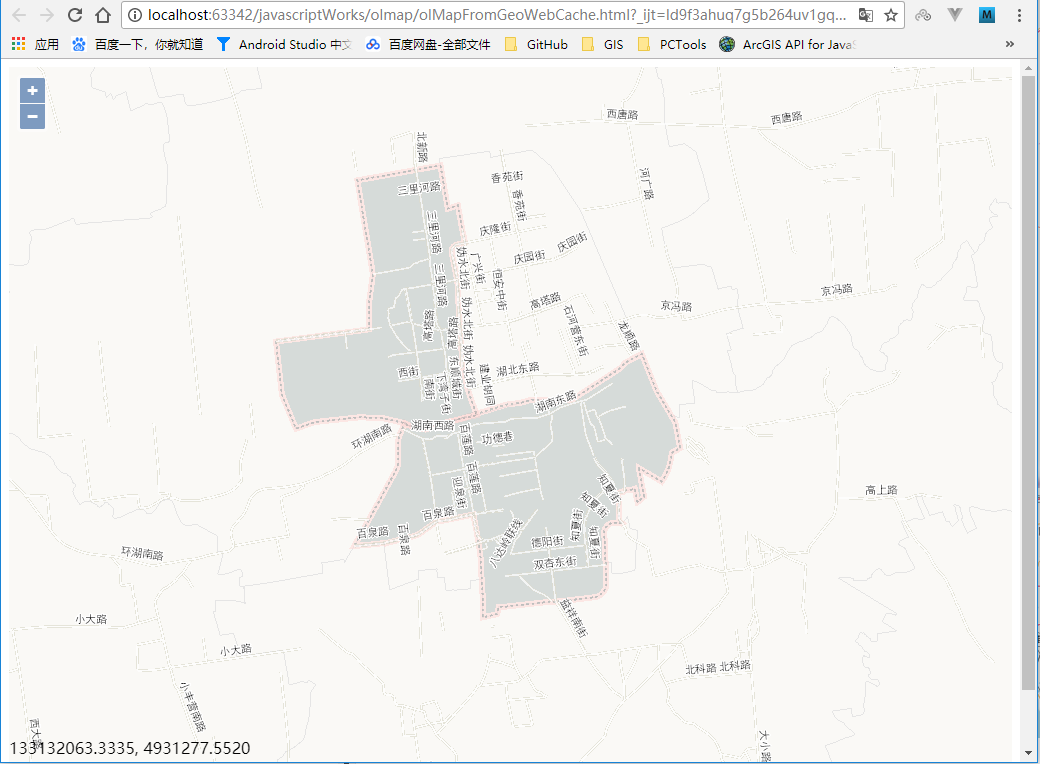
效果:

转载自:https://blog.csdn.net/sinat_25295611/article/details/79003390