

arcgis api for js之echarts开源js库实现地图统计图分析
开源js库实现地图统计图分析
前面写过一篇关于arcgis api for js实现地图统计图的,具体见:http://gishome.net.cn/arcgis-api-3x-for-js/arcgisapi3x-13/
那是基于dojo组件来实现图表统计的,实现的效果一般般;所以,本篇利用arcgis api for js结合echarts实现统计图效果,效果比之前好看,效果图如下: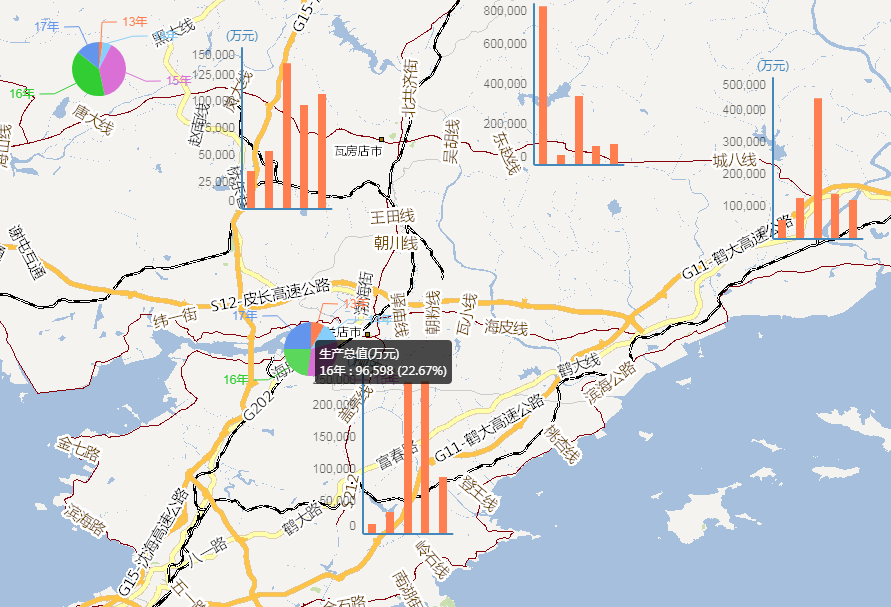

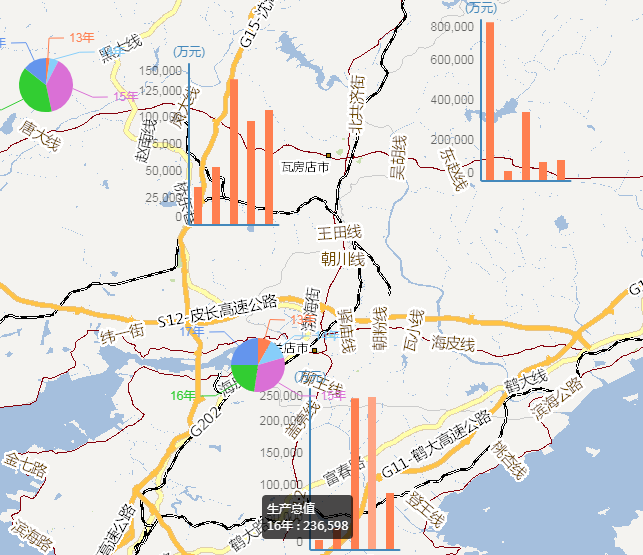

实现的思路如下:
1.自定义气泡窗口ChartInfoWindow,继承InfoWindowBase,为了echarts统计图表展示在自定义的气泡窗口里面;自定义气泡窗口ChartInfoWindow是为了适应地图上同时展示多个图表,地图默认的气泡窗口只能显示一个,不能同时显示多个的;
2.定义ChartInfoWindow的样式,具体样式如下:
.myInfoWindow {
  position: absolute;
  z-index: 100;
  -moz-box-shadow: 0 0 1em #26393D;
  font-family: sans-serif;
  font-size: 12px;
  background-color: rgba(255, 255, 255, 0);
}

/*.dj_ie .myInfoWindow {*/
  /*border: 1px solid rgba(255, 255, 255, 0);*/
/*}*/

.myInfoWindow .content {
  position: relative;
  color:#002F2F;
  overflow: auto;
  padding:2px 2px 2px 2px;
  background-color: rgba(255, 255, 255, 0);
}
3.构造模拟数据:
    //echarts统计图表模拟数据
    jsonBarData: [
                     { GDP1: 13414, GDP2: 32684, GDP3: 235687, GDP4: 236598, GDP5: 86549, UNIT: "万元", x: 121.988, y: 39.094 },
                     { GDP1: 34514, GDP2: 52684, GDP3: 135687, GDP4: 96598, GDP5: 106549, UNIT: "万元", x: 121.844, y: 39.481 },
                     { GDP1: 789014, GDP2: 42684, GDP3: 335687, GDP4: 86598, GDP5: 96549, UNIT: "万元", x: 122.191, y: 39.533 },
                     { GDP1: 56414, GDP2: 122684, GDP3: 435687, GDP4: 136598, GDP5: 116549, UNIT: "万元", x: 122.476, y: 39.445 },
                     { GDP1: 23414, GDP2: 92684, GDP3: 535687, GDP4: 436598, GDP5: 76549, UNIT: "万元", x: 122.651, y: 39.979 }
    ],
    jsonPieData: [
              { GDP1: 89414, GDP2: 82684, GDP3: 635687, GDP4: 536598, GDP5: 66549, UNIT: "万元", x: 121.639, y: 39.563 },
              { GDP1: 111414, GDP2: 62684, GDP3: 735687, GDP4: 636598, GDP5: 126549, UNIT: "万元", x: 121.891, y: 39.229 },
              { GDP1: 23614, GDP2: 72684, GDP3: 835687, GDP4: 736598, GDP5: 136549, UNIT: "万元", x: 122.211, y: 39.813 },
              { GDP1: 93414, GDP2: 132684, GDP3: 935687, GDP4: 126598, GDP5: 146549, UNIT: "万元", x: 122.614, y: 39.652 },
              { GDP1: 63414, GDP2: 222684, GDP3: 145687, GDP4: 116598, GDP5: 156549, UNIT: "万元", x: 123.144, y: 39.865 }
    ],
4.创建柱状图以及饼状图部分代码:
    loadChartBarOnMap: function (map, width, height) {
        require([
                 "esri/geometry/Point",
                 //添加自定义类型的引用
                 "CustomModules/ChartInfoWindow",
                 "dojo/_base/array",
                 "dojo/dom-construct",
                 "dojo/_base/window",
                 "dojo/domReady!"
        ], function (
                     Point, ChartInfoWindow, array, domConstruct, win
             ) {

            for (var i = 0; i < DCI.chart.jsonBarData.length; i++) {
                var chartData = null;
                chartData = [];
                var nodeChart = null;
                nodeChart = domConstruct.create("div", { id: "nodeTestBar" + i, style: "width:" + width + "px;height:" + height + "px;" }, win.body());
                var myChart = echarts.init(document.getElementById("nodeTestBar" + i));
                //柱状图
                var option = {
                    tooltip: {
                        show: true
                    },
                    grid: {*/
                        x: '40%',
                        x2: '1%',
                        y: '10%',
                        y2: '1%',
                        borderWidth: '0'//网格边框

                    },
                    xAxis: [
                        {
                            type: 'category',
                            splitLine: { show: false, },//网格线
                            data: ["13年", "14年", "15年", "16年", "17年"],
                            axisLabel: {//颜色字体
                                show: true,
                                //rotate:30,
                                textStyle: {
                                    color: 'rgba(0,0,0,0.6)'
                                }
                            },
                            axisTick: {//x轴刻度
                                show: false
                            }
                        }
                    ],
                    yAxis: [
                        {
                            type: 'value',
                            splitLine: { show: false, },//网格线
                            name: '(万元)',
                            axisLabel: {//颜色字体
                                show: true,
                                textStyle: {
                                    color: 'rgba(0,0,0,0.6)'
                                }
                            }
                        }
                    ],
                    series: [
                        {
                            "name": "生产总值",
                            "type": "bar",
                            "barWidth": 8,
                            //itemStyle: {normal: {color: '#2466c9'}},//设置颜色
                            "data": [DCI.chart.jsonBarData[i].GDP1,
                                    DCI.chart.jsonBarData[i].GDP2,
                                    DCI.chart.jsonBarData[i].GDP3,
                                    DCI.chart.jsonBarData[i].GDP4,
                                    DCI.chart.jsonBarData[i].GDP5]
                        }
                    ]
                };
                // 为echarts对象加载数据
                myChart.setOption(option);
                var chartPoint = null;
                chartPoint = new Point(DCI.chart.jsonBarData[i].x, DCI.chart.jsonBarData[i].y, MapConfig.mapInitParams.spatialReference);
                var chartInfo = new ChartInfoWindow({
                    map: map,
                    chart: nodeChart,
                    chartPoint: chartPoint,
                    width: width+30,
                    height: height+25
                });
            }

        });
    },
    loadChartPieOnMap: function (map, width, height) {
        require([
                 "esri/geometry/Point",
                 //添加自定义类型的引用
                 "CustomModules/ChartInfoWindow",
                 "dojo/_base/array",
                 "dojo/dom-construct",
                 "dojo/_base/window",
                 "dojo/domReady!"
        ], function (
                     Point, ChartInfoWindow, array, domConstruct, win
             ) {
            for (var i = 0; i < DCI.chart.jsonPieData.length; i++) {
                var chartData = null;
                chartData = [];
                var nodeChart = null;
                nodeChart = domConstruct.create("div", { id: "nodeTestPie" + i, style: "width:" + width + "px;height:" + height + "px;" }, win.body());
                var myChart = echarts.init(document.getElementById("nodeTestPie" + i));
                //饼状图
                option = {
                    tooltip: {
                        trigger: 'item',
                        z: 999,
                        formatter: "{a}(万元) <br/>{b} : {c} ({d}%)"
                    },
                    calculable: false,
                    series: [
                        {
                            name: "生产总值",
                            type: "pie",
                            radius: "30%",
                            center: ["50%", "60%"],
                            data: [
                                { value: DCI.chart.jsonBarData[i].GDP1, name: "13年" },
                                { value: DCI.chart.jsonBarData[i].GDP2, name: "14年" },
                                { value: DCI.chart.jsonBarData[i].GDP3, name: "15年" },
                                { value: DCI.chart.jsonBarData[i].GDP4, name: "16年" },
                                { value: DCI.chart.jsonBarData[i].GDP5, name: "17年" }
                            ]
                        }
                    ]
                };
                // 为echarts对象加载数据
                myChart.setOption(option);
                var chartPoint = null;
                chartPoint = new Point(DCI.chart.jsonPieData[i].x, DCI.chart.jsonPieData[i].y, MapConfig.mapInitParams.spatialReference);
                var chartInfo = new ChartInfoWindow({
                    map: map,
                    chart: nodeChart,
                    chartPoint: chartPoint,
                    width: width+5,
                    height: height+25
                });
            }
        });
},- arcgis api离线部署
- 不同地图服务展示
- 地图工具栏
- 地图查询
- 地图态势标绘
- 地图分屏对比
- 图层控制
- 聚合效果
- 热力图效果
- 叠加SHP图层
- 地图统计图
- 地图打印(GP服务)
- 地图最短路径分析
- 最近设施点路径分析
- 台风轨迹
- 迁徙流动图
- 在线地图(天地图、百度地图、高德地图)
- 风向流动图
- 图层在线编辑
- 打印地图的那些事
- 气泡窗口信息动态配置模板
干货:


