

Leaflet 官方教程 Zoom levels 缩放级别
目录
A deeper look into what zoom levels are.
本教程带你深入了解缩放级别。
Zoom levels
缩放级别
Leaflet works with latitude, longitude and “zoom level”.
Leaflet包括经度、纬度以及”缩放级别”。
Lower zoom levels means that the map shows entire continents, while higher zoom levels means that the map can show details of a city.
低缩放级别地图显示大洲,到高缩放级别地图可能会显示城市细节。
To understand how zoom levels work, first we need a basic introduction to geodesy.
为了弄清缩放级别,我们有必要先来介绍一些大地测量学的基础知识。
The shape of the earth
地球的形状
Let’s have a look at a simple map locked at zoom zero:
我们来看一下一个缩放级别锁定为0的简单地图。
    var map = L.map('map', {
        minZoom: 0,
        maxZoom: 0
    });

    var positron = L.tileLayer('http://{s}.basemaps.cartocdn.com/light_all/{z}/{x}/{y}.png', {
        attribution: cartodbAttribution
    }).addTo(map);

    map.setView([0, 0], 0);


| See this example stand-alone. |
Notice that the “whole earth” is just one image, 256 pixels wide and 256 pixels high:
注意,“全世界”只有一张图片,256*256像素大小:


Just to be clear: the earth is not a square. Rather, the earth is shaped like a weird potato that can be approximated to something similar to a sphere.
你要清楚:地球不是方的。事实上,地球形状倒像个怪土豆,接近于球体。

Potato earth image by NASA/JPL/University of Texas Center for Space Research with help of the GRACE satellites.
So we assume that the earth is mosly round. To make it flat, we put an imaginary cylinder around, unroll it, and cut it so it looks square:
我们假设地球基本上是圆的。为了让它变成平的,我们用一个想象的圆柱套住它,然后展开,并进行切分,然后她看起来就是平的了。
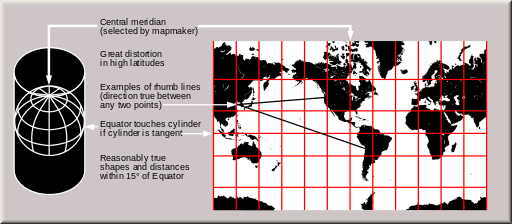
This is called a “cylindrical map projection”.这被称为“圆柱投影”

This is not the only way of displaying the surface on the earth on a plane. There are hundreds of ways, each of them with its own advantages and disadvantages. The following 6-minute video is a nice introduction to the topic:
这并非在平面上展示地球表面的唯一方法。有上百种方法可以实现,每一种都有自己的优缺点。下面的6分钟的视频对此作了很好的介绍(视频来自YouTube,看不了)。
Things like geodesy, map projections and coordinate systems are hard, very hard (and out of scope for this tutorial). Assuming that the earth is a square is not always the right thing to do, but most of the time works fine enough, makes things simpler, and allows Leaflet (and other map libraries) to be fast.
大地测量学、地图投影、坐标系统等知识都很难,很难(同时也超出了本教程的的范围)。假设地球表面展开后是方的并不总是正确的,不过大部分情况下运行良好,这使问题变得简单,让Leaflet(以及其他地图包)运行更快。
Powers of two
加倍的效果
For now, let’s just assume that the world is a square:
现在,我们只管假设世界是方的:
When we represent the world at zoom level zero, it’s 256 pixels wide and high. When we go into zoom level one, it doubles its width and height, and can be represented by four 256-pixel-by-256-pixel images:
我们展示0级世界地图时,它是256*256像素大小。切换到1级别时,宽和高都变为原来的两倍,需要4个256*256像素图片表示。

At each zoom level, each tile is divided in four, and its size (length of the edge, given by the tileSize option) doubles, quadrupling the area. (in other words, the width and height of the world is 256·2zoomlevel pixels):
在每一层级,每个切片都被一分为四,其大小(边的长度,有tileSize option给出)加倍,(屏幕像素)面积变为原来的四倍。(也即:世界的长和宽为256*2^zoomlevel 像素):


This goes on and on. Most tile services offer tiles up to zoom level 18, depending on their coverage. This is enough to see a few city blocks per tile.
这一特性在每个层级延续。有好些切片服务能够提供到18级的切片,这取决于他们的规模。到18级就可以看清城市的街区了。
A note about scale
scale笔记
One of the disadvantages of using a cylindrical projection is that the scale is not constant, and measuring distances or sizes is not reliable, specially at low zoom levels.
圆柱投影的问题之一在于其比例尺不是一个常数,测量的距离和面积都不可信,尤其是缩放级别较低时。
In technical terms, the cylindrical projection that Leaflet uses is conformal (preserves shapes), but not equidistant(does not preserve distances), and not equal-area (does not preserve areas, as things near the equator appear smaller than they are).
用行话来说就是,Leaflet使用的圆柱投影是等角的(保持形状),但不是等距的(有长度变形),也不是等面积的(有面积变形,在赤道附近面积会变小)。
By adding a L.Control.Scale to a map, and panning to the equator and to 60° north, we can see how the scale factor doubles. The following example uses javascript timeouts to do this automatically:
为地图添加一个L.Control.Scale,并且将视野拖放到北纬60度,我们会看到地图比例尺加倍了。下面的示例代码通过JavaScript的timeouts函数将这一过程自动化执行。
    L.control.scale().addTo(map);

    setInterval(function(){
        map.setView([0, 0]);
        setTimeout(function(){
            map.setView([60, 0]);
        }, 2000);
    }, 4000);
| See this example stand-alone. |
L.Control.Scale shows the scale which applies to the center point of the map. At high zoom levels, the scale changes very little, and is not noticeable.
L.Control.Scale显示地图中心点位置的比例尺。在高缩放级别下,(拖动地图)比例尺变化不明显,不容易观察出来。
Controlling the zoom
控制缩放
A leaflet map has several ways to control the zoom level shown, but the most obvious one is setZoom(). For example, map.setZoom(0); will set the zoom level of map to 0.
Leaflet 地图有很多方式控制显示级别,最常用的是方法setZoom()。例如,map.setZoom(0);会将地图的缩放级别设置为0。
This example again uses timeouts to alternate between zoom levels 0 and 1 automatically:
下面的例子同样使用了setTimeout方法来控制缩放级别在0 和1 之间自动轮换:
    setInterval(function(){
        map.setZoom(0);
        setTimeout(function(){
            map.setZoom(1);
        }, 2000);
    }, 4000);
| See this example stand-alone. |
Notice how the images shown at zoom levels 0 and one correspond with the images shown in the previous section!
注意观察0级和1级的图片,与上一节展示的一致。
Other ways of setting the zoom are:
其他设置缩放级别的方法:
setView(center, zoom), which also sets the map center- setView(center, zoom),该方法可以同时设置地图中心点坐标
flyTo(center, zoom), likesetViewbut with a smooth animation- flyTo(center,zoom),与setView类似,区别在于有一个平滑动画效果
zoomIn()/zoomIn(delta), zooms indeltazoom levels,1by default- zoomIn()/zoomIn(delta),放大delta指定的缩放级别,delta默认值为1
zoomOut()/zoomOut(delta), zooms outdeltazoom levels,1by default- zoomOut()/zoomOut(delta),缩小delta 缩放级别,delta默认为1
setZoomAround(fixedPoint, zoom), sets the zoom level while keeping a point fixed (what scrollwheel zooming does)- setZoomAround(fixedPoint, zoom),设置缩放级别,保持一个点坐标不变(滚轮缩放就是这样的)
fitBounds(bounds), automatically calculates the zoom to fit a rectangular area on the map- fitBounds(bounds),自动计算缩放级别,适配参数指定的矩形坐标区域。
Fractional zoom
带小数的缩放级别
A feature introduced in Leaflet 1.0.0 was the concept of fractional zoom. Before this, the zoom level of the map could be only an integer number (0, 1, 2, and so on); but now you can use fractional numbers like 1.5 or 1.25.
Leaflet 1.0.0引入了一个新特性带小数的缩放级别。在此之前缩放级别只能是整数(0,1,2等等);现在可以使用小数了,例如1.5或者1.25。
Fractional zoom is disabled by default. To enable it, use the map’s zoomSnap option. The zoomSnap option has a default value of 1 (which means that the zoom level of the map can be 0, 1, 2, and so on).
小数缩放级别默认是禁用的。可以通过地图的zoomSnap属性启用。zoomSnap属性默认值为1(这意味着缩放级别是0,1,2这样的数)。
If you set the value of zoomSnap to 0.5, the valid zoom levels of the map will be 0, 0.5, 1, 1.5, 2, and so on.
如果将zoomSnap的值设为0.5,缩放级别的有效值将会是0,0.5,1,1.5,2等等。
If you set a value of 0.1, the valid zoom levels of the map will be 0, 0.1, 0.2, 0.3, 0.4, and so on.
如果设置为0.1,缩放级别的有效值会变为0,0.1,0.2,0.3,0.4等等。
The following example uses a zoomSnap value of 0.25:
下面的例子中地图zoomSnap属性被设置为0.25:
    var map = L.map('map', {
        zoomSnap: 0.25
    });
| See this example stand-alone. |
As you can see, Leaflet will only load the tiles for zoom levels 0 or 1, and will scale them as needed.
可以看到,Leaflet只会加载0,1级别的切片,并在其他非整数缩放级别将切片缩放展示。
Leaflet will snap the zoom level to the closest valid one. For example, if you have zoomSnap: 0.25 and you try to do map.setZoom(0.8), the zoom will snap back to 0.75. The same happens with map.fitBounds(bounds), or when ending a pinch-zoom gesture on a touchscreen.
Leaflet 会将缩放级别约束为最接近的有效值。例如,如果你将zoomSnap设置为0.25,并调用map.setZoom(0.8),缩放级别将被调整为0.75。同样的,当调用map.fitBounds(bounds)或在触摸屏上通过手指缩放时zoomSnap都会起作用。
zoomSnap can be set to zero. This means that Leaflet will not snap the zoom level.
zoomSnap可以设置为0,这意味着,Leaflet将不再约束缩放级别。
There is another important map option related to zoomSnap: the zoomDelta option. This controls how many zoom levels to zoom in/out when using the zoom buttons (from the default L.Control.Zoom) or the +/- keys in your keyboard.
还有一个与zoomSnap相关的重要的地图属性:zoomDelta属性。该属性控制 缩放控件(L.Control.Zoom)及键盘+/-键 每次缩放地图的级别。
For the mousewheel zoom, the wheelPxPerZoomLevel option controls how fast the mousewheel zooms in or out.
对于滚轮缩放, wheelPxPerZoomLevel属性控制管轮缩放的速度。
Here is an example with zoomSnap set to zero:
下面的例子中zoomSnap值为0:
    var map = L.map('map', {
        zoomDelta: 0.25,
        zoomSnap: 0
    });
Try the following, and see how the zoom level changes:
尝试下面的操作,观察缩放级别的变化情况:
- Pinch-zoom if you have a touchscreen
- 通过手势缩放,如果你的屏幕是触摸屏。
- Zoom in/out with your mousewheel
- 通过鼠标滚轮缩放
- Do a box zoom (drag with your mouse while pressing the
shiftkey in your keyboard) - 框选缩放(按下shift键并拖拽鼠标)
- Use the zoom in/out buttons
- 通过缩放组件缩放。
| See this example stand-alone. |
That concludes this tutorial. Now play with your zoom levels in your maps!
教程结束,动手试试吧。
转载自:https://blog.csdn.net/pyluyuan/article/details/81613130


