leaflet入门——地图加载(以arcgis服务为例)
目录
最近由于项目需求,于是开始了leaflet的学习,leaflet在加载地图上具有自己独特的优势,能够在各种浏览器(包括手机)下面很好的运行,并且具有很多的插件供我们选择。在该教程中, 我们使用了除leaflet之外的额外插件有 esri-leaflet.js(https://esri.github.io/esri-leaflet/)、L.Control.MousePosition.js(https://github.com/ardhi/Leaflet.MousePosition)、【proj4.js与proj4leaflet.js】(https://github.com/kartena/Proj4Leaflet)。
1. 动态图层加载
在加载还图层的时候注意,此时的URL只能是动态图层服务地址,不能具体到某个图层。加载代码如下:
let map =  L.map('divclass').setView([28.751407,118.628740],12);
let dynamicLayer = L.esri.dynamicMapLayer({
    url:'http://localhost:6080/arcgis/rest/services/js/jsdxt/MapServer/',
    opacity: 0.8,
    f:'json'
});
map.addLayer(dynamicLayer);
2. 要素图层加载
let map =  L.map('divclass').setView([28.751407,118.628740],12);
let featureLayer = L.esri.featureLayer({
    url:'http://localhost:6080/arcgis/rest/services/js/tx/MapServer/1/'
});
map.addLayer(featureLayer);
3. 切片图层的加载
our map service must be published using the Web Mercator Auxiliary Sphere tiling scheme (WKID 102100/3857) and the default scale options used by Google Maps, Bing Maps and .Esri Leaflet will not support any other spatial reference for tile layers.
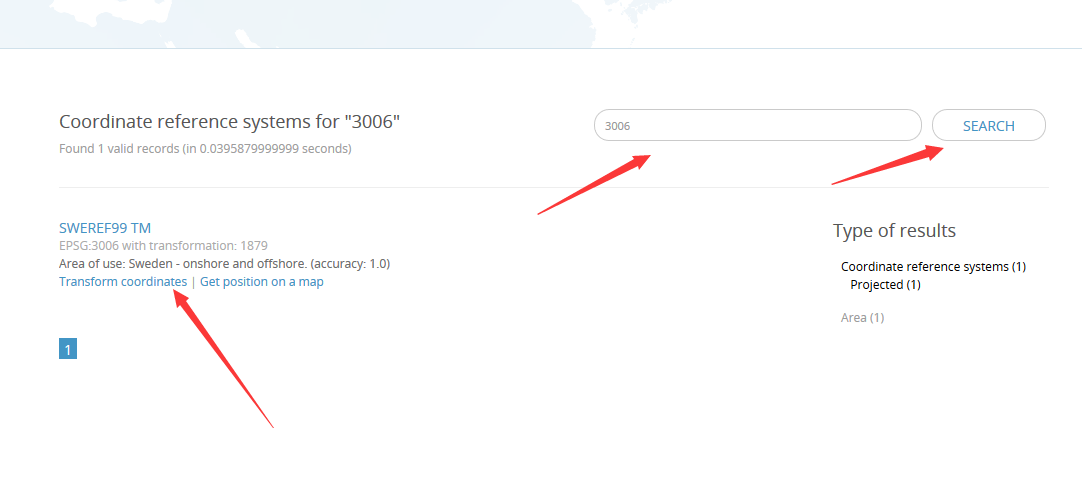
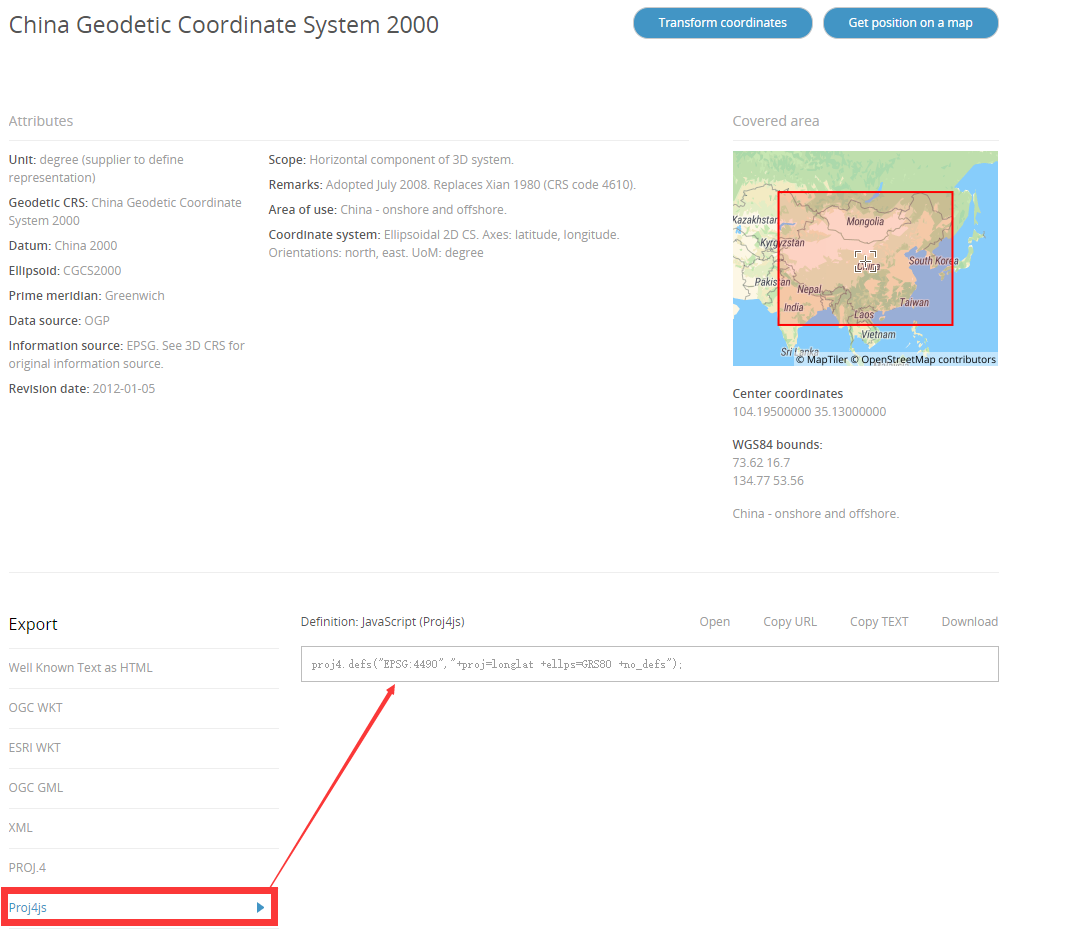
这个摘自官方的一段(https://esri.github.io/esri-leaflet/api-reference/layers/tiled-map-layer.html),大概的意思是当我们使用L.esri.tiledMapLayer的时候,支持WKID为102100/3857的投影地图,既是我们平常使用的web墨卡托投影的地图,其余的地图投影不支持,此时我们就需要用到proj4.js与proj4leaflet.js这两个库来进行自定义投影,具体的投影转换已经各种参数的定义,我们可以通过(https://epsg.io/)这个网站来获取,比如我们搜索4490,如下图,箭头所指的就是我们使用Proj4来进行投影时的定义参数:

当我们获取到了投影参数之后,我们就可以使用L.Proj.CRS来定义一个投影了,具体代码如下:
let tileMapUrl ="http://localhost:6082/arcgis/rest/services/jhzhps/JHJT/MapServer";
    let CRS_4490 = new L.Proj.CRS("EPSG:4490", "+proj=longlat +ellps=GRS80 +no_defs", {
        resolutions: [
            1.40625,
            0.703125,
            0.3515625,
            0.17578125,
            0.087890625,
            0.0439453125,
            0.02197265625,
            0.010986328125,
            0.0054931640625,
            0.00274658203125,
            0.001373291015625,
            6.866455078125E-4,
            3.4332275390625E-4,
            1.71661376953125E-4,
            8.58306884765625E-5,
            4.291534423828125E-5,
            2.1457672119140625E-5,
            1.0728836059570312E-5,
            5.364418029785156E-6,
            2.682209064925356E-6,
            1.3411045324626732E-6
        ],
        origin: [-179.9999, 90.00016],
        bounds: L.bounds([117.75370429660006, 26.99449191557761, ], [123.63262097540007, 32.2668788575695])
        //这里可以有origin、transformation、scales、resulutions、bounds几个参数提供
        //选择,其中scales与resolutions不能同时配置
    });
    let map = L.map('divclass',{
        crs:CRS_4490
    }).setView([29.108339,119.647787],13);
    let tileMapLayer = L.esri.tiledMapLayer({
        url:tileMapUrl
    });
    //L.esri.basemapLayer('Gray').addTo(map);
    map.addLayer(tileMapLayer);

    L.control.mousePosition({
        'position': 'bottomright'
    }).addTo(map);
此时,我们已经完成了对切片,要素,动态地图的加载,此代码仅供初学者学习借鉴,整个文件的代码如下图所示:
<!DOCTYPE html>
<html>
<head>
    <meta charset="utf-8">
    <title>leaflet实例</title>
    <meta name="renderer" content="webkit">
    <meta http-equiv="X-UA-Compatible" content="IE=edge,chrome=1">
    <meta name="viewport" content="width=device-width, initial-scale=1.0, minimum-scale=1.0, maximum-scale=1.0, user-scalable=0">
    <!--添加leaflet样式文件-->
    <link rel="stylesheet" type="text/css" href="../floodIndex/leaflet/leaflet.css">
    <link rel="stylesheet" type="text/css" href="../floodIndex/css/L.Control.MousePosition.css">
    <!--添加leaflet引用-->
    <script type="text/javascript" src="../floodIndex/leaflet/leaflet-src.js"></script>
    <script type="text/javascript" src="../floodIndex/leaflet/esri-leaflet.js"></script>
    <script type="text/javascript" src="../floodIndex/leaflet/L.Control.MousePosition.js"></script>
    <script type="text/javascript" src="../floodIndex/leaflet/proj4.js"></script>
    <script type="text/javascript" src="../floodIndex/leaflet/proj4leaflet.js"></script>
    <style>
        html,body{
            margin:0;
            padding: 0;
        }
        #divclass{
            height:calc(100% - 50px) ;
            width: 100%;
            background: white;
            position: absolute;
        }
    </style>
</head>
<body>
    <div style="width: 100%;height: 50px">

    </div>
  <div id="divclass">

  </div>

<script>


    //1. 动态图层加载 注意此时的URL只能是动态图层服务地址 只能具体到某个图层
    let map =  L.map('divclass').setView([28.751407,118.628740],12);
    let dynamicLayer = L.esri.dynamicMapLayer({
        url:'http://localhost:6080/arcgis/rest/services/js/jsdxt/MapServer/',
        opacity: 0.8,
        f:'json'
    });
    map.addLayer(dynamicLayer);

    //2.加载要素图层
    let map =  L.map('divclass').setView([28.751407,118.628740],12);
    let featureLayer = L.esri.featureLayer({
        url:'http://localhost:6080/arcgis/rest/services/js/tx/MapServer/1/'
    });
    map.addLayer(featureLayer);
    //3.加载切片图层
    /**
     * Your map service must be published using the Web Mercator Auxiliary Sphere tiling scheme (WKID 102100/3857)
     * and the default scale options used by Google Maps, Bing Maps and .
     * Esri Leaflet will not support any other spatial reference for tile layers.
     */
    let tileMapUrl ="http://localhost:6082/arcgis/rest/services/jhzhps/JHJT/MapServer";
    let CRS_4490 = new L.Proj.CRS("EPSG:4490", "+proj=longlat +ellps=GRS80 +no_defs", {
        resolutions: [
            1.40625,
            0.703125,
            0.3515625,
            0.17578125,
            0.087890625,
            0.0439453125,
            0.02197265625,
            0.010986328125,
            0.0054931640625,
            0.00274658203125,
            0.001373291015625,
            6.866455078125E-4,
            3.4332275390625E-4,
            1.71661376953125E-4,
            8.58306884765625E-5,
            4.291534423828125E-5,
            2.1457672119140625E-5,
            1.0728836059570312E-5,
            5.364418029785156E-6,
            2.682209064925356E-6,
            1.3411045324626732E-6
        ],
        origin: [-179.9999, 90.00016],
        bounds: L.bounds([117.75370429660006, 26.99449191557761, ], [123.63262097540007, 32.2668788575695])
        //这里可以有origin、transformation、scales、resulutions、bounds几个参数提供
        //选择,其中scales与resolutions不能同时配置
    });
    let map = L.map('divclass',{
        crs:CRS_4490
    }).setView([29.108339,119.647787],13);
    let tileMapLayer = L.esri.tiledMapLayer({
        url:tileMapUrl
    });
    //L.esri.basemapLayer('Gray').addTo(map);
    map.addLayer(tileMapLayer);

    L.control.mousePosition({
        'position': 'bottomright'
    }).addTo(map);
</script>
</body>
</html>
转载自:https://blog.csdn.net/u012320231/article/details/81905986