OL4两种绘制台风圈方式的比较
前言:今天在一个群里面看到台风圈的,感觉很好奇,就想着能否用canvas结合OL4实现下,何为台风圈先来张图:
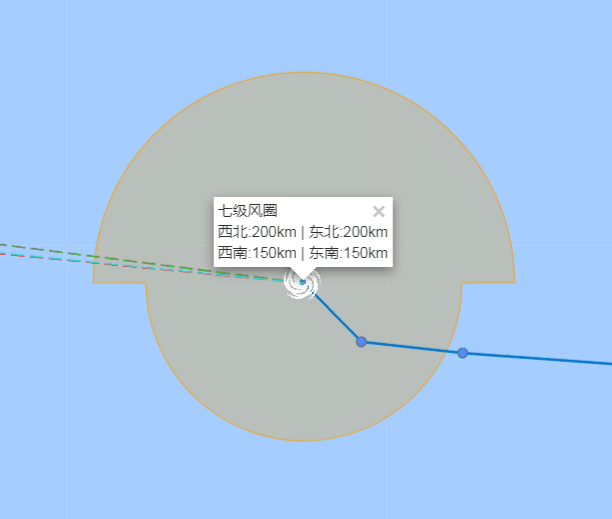

一、实现原理
1、先画上半圆
2、在下半圆
3、最后画半圆相接线
关于canvas画圆弧知识点
-
arc(x, y, r, startAngle, endAngle, anticlockwise):以
(x, y)为圆心,以r为半径,从startAngle弧度开始到endAngle弧度结束。anticlosewise是布尔值,true表示逆时针,false表示顺时针。(默认是顺时针)注意:
- 这里的度数都是弧度。
0弧度是指的x轴正方形-
radians=(Math.PI/180)*degrees //角度转换成弧度
使用案例:
function draw(){
    var canvas = document.getElementById('tutorial');
    if (!canvas.getContext) return;
    var ctx = canvas.getContext("2d");
    ctx.beginPath();
    ctx.arc(50, 50, 40, 0, Math.PI / 2, false);
    ctx.stroke();
}
draw();
二、核心代码
        var createWindCircle = function () {
            var canvas = document.getElementById("canvas");
            var ctx = canvas.getContext("2d");
            ctx.lineWidth = 2;
            ctx.fillStyle = "#e7e9d1";
            ctx.strokeStyle = "#c88799";
            //画上半圆
            ctx.beginPath(); //新建一条path
            ctx.arc(150, 150, 40, 0, Math.PI, true);
            ctx.fill();
            ctx.stroke();
            //画下半圆
            ctx.beginPath();
            ctx.arc(150, 150, 20, Math.PI, 2 * Math.PI, true);
            ctx.fill();
            ctx.stroke();
            //画左边两圆相接线
            ctx.beginPath();
            ctx.moveTo(130, 150);
            ctx.lineTo(110, 150);
            ctx.fill();
            ctx.stroke();
            //画右边两圆相接线
            ctx.beginPath();
            ctx.moveTo(170, 150);
            ctx.lineTo(190, 150);
            ctx.fill();
            ctx.stroke();
            var point_overlay = new ol.Overlay({
                element: canvas,
                positioning: 'center-center'
            });
            map.addOverlay(point_overlay);
            point_overlay.setPosition(coordinate);
        }
        createWindCircle();
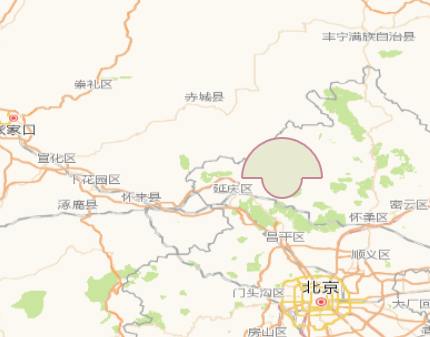
三、效果图

四、另一种方法绘制台风圈(别人写的)
该方法主要用了WKT生成要素,添加到矢量图层,这种方法比较,上面那种台风圈,有偏移,绘制台风圈用下面的全部代码
<html xmlns="http://www.w3.org/1999/xhtml">
<head>
    <meta http-equiv="Content-Type" content="text/html; charset=utf-8" />
    <title>Ol3 draw</title>
    <link href="../script/ol3/ol.css" rel="stylesheet" />
    <style type="text/css">
        body, #map {
            border: 0px;
            margin: 0px;
            padding: 0px;
            width: 100%;
            height: 100%;
            font-size: 13px;
        }
    </style>
    <script src="../script/ol3/ol.js"></script>
    <script src="../../Scripts/jquery/jquery-3.1.1.min.js"></script>
    <script type="text/javascript">
        var wktformat = new ol.format.WKT();
        function init() {
            var Configs = {
                CIRCLE_CENTER_X: 104.21390114106414,
                CIRCLE_CENTER_Y: 35.847595169932646,
                CIRCLE_R: {
                    "SE": 0.5,
                    "NE": 0.3,
                    "NW": 0.2,
                    "SW": 0.3
                }
            };
            var wkt = "POLYGON((";
            var wkt0 = "", _interval = 6;
            for (var i = 0; i < 360 / _interval ; i++) {
                var _r = 0;
                var _ang = i * _interval;
                console.log(_ang);
                if (_ang > 0 && _ang <= 90) {
                    _r = Configs.CIRCLE_R.NE;
                }
                else if (_ang > 90 && _ang <= 180) {
                    _r = Configs.CIRCLE_R.NW;
                }
                else if (_ang > 180 && _ang <= 270) {
                    _r = Configs.CIRCLE_R.SW;
                }
                else {
                    _r = Configs.CIRCLE_R.SE;
                }
                var x = Configs.CIRCLE_CENTER_X + _r * Math.cos(_ang * 3.14 / 180);
                var y = Configs.CIRCLE_CENTER_Y + _r * Math.sin(_ang * 3.14 / 180);

                wkt = wkt + "" + x + " " + y + ", ";
                if (i === 0) {
                    wkt0 = "" + x + " " + y + "";
                }
            }
            wkt = wkt + wkt0 + "))";
            var features = new Array();
            features.push(wktformat.readFeature(wkt));
            features.push(wktformat.readFeature("POINT(" + Configs.CIRCLE_CENTER_X + " " + Configs.CIRCLE_CENTER_Y + ")"));

            var styleFunc = function (feature, resolution) {
                var index = feature.get("index");
                return new ol.style.Style({
                    fill: new ol.style.Fill({
                        color: 'rgba(255, 0, 0, 0.2)'
                    }),
                    stroke: new ol.style.Stroke({
                        color: '#ffcc33',
                        width: 2
                    }),
                    image: new ol.style.Circle({
                        radius: 4,
                        fill: new ol.style.Fill({
                            color: '#ff0000'
                        })
                    })
                });
            };
            var vector = new ol.layer.Vector({
                source: new ol.source.Vector({
                    features: features
                }),
                style: styleFunc
            });
            var map = new ol.Map({
                controls: ol.control.defaults({
                    attribution: false
                }),
                target: 'map',
                layers: [vector],
                view: new ol.View({
                    projection: new ol.proj.Projection({
                        code: 'EPSG:4326',
                        units: 'degrees'
                    }),
                    center: [103.847, 36.0473],
                    zoom: 4
                })
            });
        }
    </script>
</head>
<body onLoad="init()">
    <div id="map">
    </div>
</body>
</html>
转载自:https://blog.csdn.net/weixin_40184249/article/details/82533158