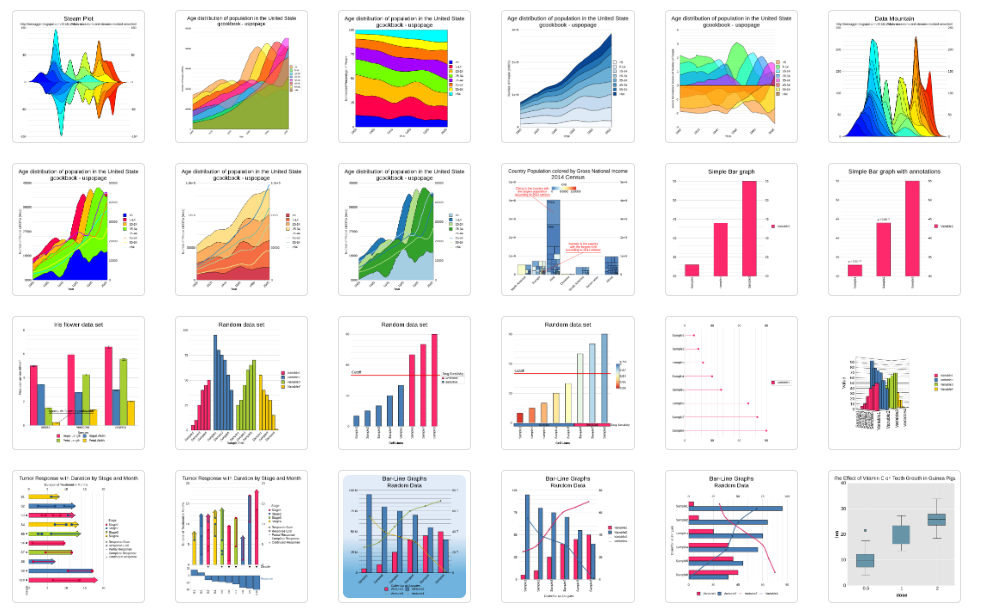
结合echart图表展示信息
结合echarts与leaflet展示信息
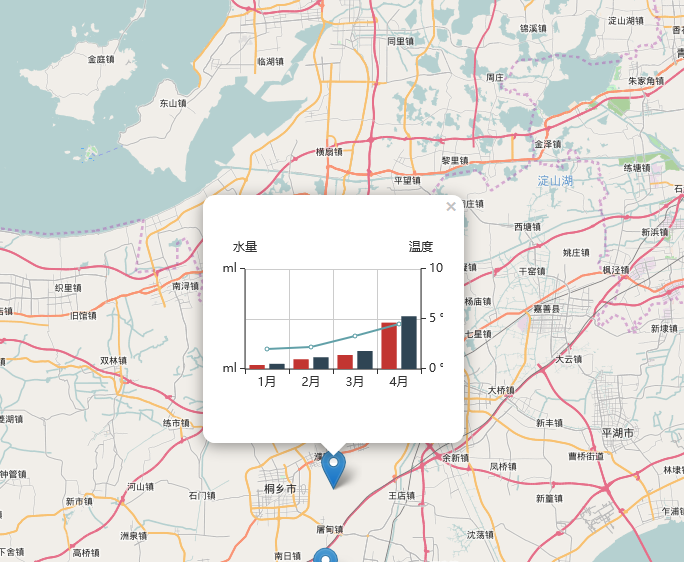
1.popup中添加图表信息
//定义marker
                  var marker = L.marker(val.location).addTo(map);
                  var content = '<div style="width: 220px; height: 220px;" id="marker' + val.id + '"></div>';
                  marker.bindPopup(content, {});
                  marker.on('popupopen', function(e) {
                      // 基于准备好的dom,初始化echarts实例
                      var myChart = echarts.init(document.getElementById('marker' + val.id));
                      // 指定图表的配置项和数据
                      option = {
                          tooltip: {
                              trigger: 'axis'
                          },
                          xAxis: [{
                              type: 'category',
                              data: ['1月', '2月', '3月', '4月']
                          }],
                          yAxis: [{
                              type: 'value',
                              name: '水量',
                              min: 0,
                              max: 50,
                              interval: 50,
                              axisLabel: {
                                  formatter: '{value} ml'
                              }
                          }, {
                              type: 'value',
                              name: '温度',
                              min: 0,
                              max: 10,
                              interval: 5,
                              axisLabel: {
                                  formatter: '{value} °C'
                              }
                          }],
                          series: [{
                              name: '蒸发量',
                              type: 'bar',
                              data: [2.0, 4.9, 7.0, 23.2]
                          }, {
                              name: '降水量',
                              type: 'bar',
                              data: [2.6, 5.9, 9.0, 26.4]
                          }, {
                              name: '平均温度',
                              type: 'line',
                              yAxisIndex: 1,
                              data: [2.0, 2.2, 3.3, 4.5]
                          }]
                      };
                      // 使用刚指定的配置项和数据显示图表。
                      myChart.setOption(option);
                  });
2.echat以控件形式添加在map中

 .chart {
    width: 500px;
    height: 300px;
    background-color: white;
}
var chart = L.control({position: 'bottomright'});
chart.onAdd = function (map) {
var div = L.DomUtil.create('div', 'info chart');
div.id="chatrdemo";
return div;
};
chart.addTo(map);
// 基于准备好的dom,初始化echarts实例
var myChart = echarts.init(document.getElementById('chatrdemo'));
// 指定图表的配置项和数据
option = {
tooltip: {
trigger: 'axis'
},
xAxis: [{
type: 'category',
data: ['1月', '2月', '3月', '4月']
}],
yAxis: [{
type: 'value',
name: '水量',
min: 0,
max: 50,
interval: 50,
axisLabel: {
formatter: '{value} ml'
}
}, {
type: 'value',
name: '温度',
min: 0,
max: 10,
interval: 5,
axisLabel: {
formatter: '{value} °C'
}
}],
series: [{
name: '蒸发量',
type: 'bar',
data: [2.0, 4.9, 7.0, 23.2]
}, {
name: '降水量',
type: 'bar',
data: [2.6, 5.9, 9.0, 26.4]
}, {
name: '平均温度',
type: 'line',
yAxisIndex: 1,
data: [2.0, 2.2, 3.3, 4.5]
}]
};
// 使用刚指定的配置项和数据显示图表。
myChart.setOption(option);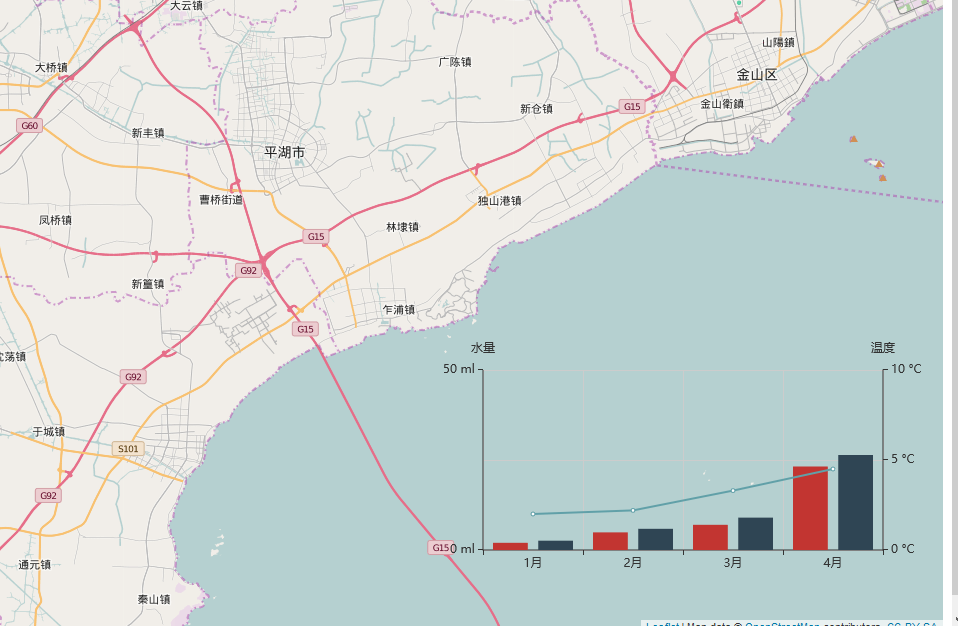
3.以marker形式添加在map

var pictures = L.marker(val.location, {
                      icon: L.divIcon({
                          className: 'leaflet-echart-icon',
                          iconSize: [160, 160],
                          html: '<div id="marker' + val.id + '" style="width: 160px; height: 160px; position: relative; background-color: transparent;">asd</div>'
                      })
                  }).addTo(map);
                  // 基于准备好的dom,初始化echarts实例
                  var myChart = echarts.init(document.getElementById('marker' + val.id));
                  // 指定图表的配置项和数据
                  option = {
                      tooltip: {
                          trigger: 'item',
                          formatter: "{a} <br/>{b}: {c} ({d}%)"
                      },
                      series: [{
                          name: '访问来源',
                          type: 'pie',
                          radius: ['20', '50'],
                          avoidLabelOverlap: false,
                          label: {
                              normal: {
                                  show: false,
                                  position: 'center'
                              },
                              emphasis: {
                                  show: true,
                                  textStyle: {
                                      fontSize: '18',
                                      fontWeight: 'bold'
                                  }
                              }
                          },
                          labelLine: {
                              normal: {
                                  show: false
                              }
                          },
                          data: [{
                              value: val.value1,
                              name: '直接访问'
                          }, {
                              value: val.value2,
                              name: '邮件营销'
                          }, {
                              value: val.value3,
                              name: '联盟广告'
                          }, {
                              value: val.value4,
                              name: '视频广告'
                          }, {
                              value: 20,
                              name: '搜索引擎'
                          }]
                      }]
                  };
                  // 使用刚指定的配置项和数据显示图表。
                  myChart.setOption(option);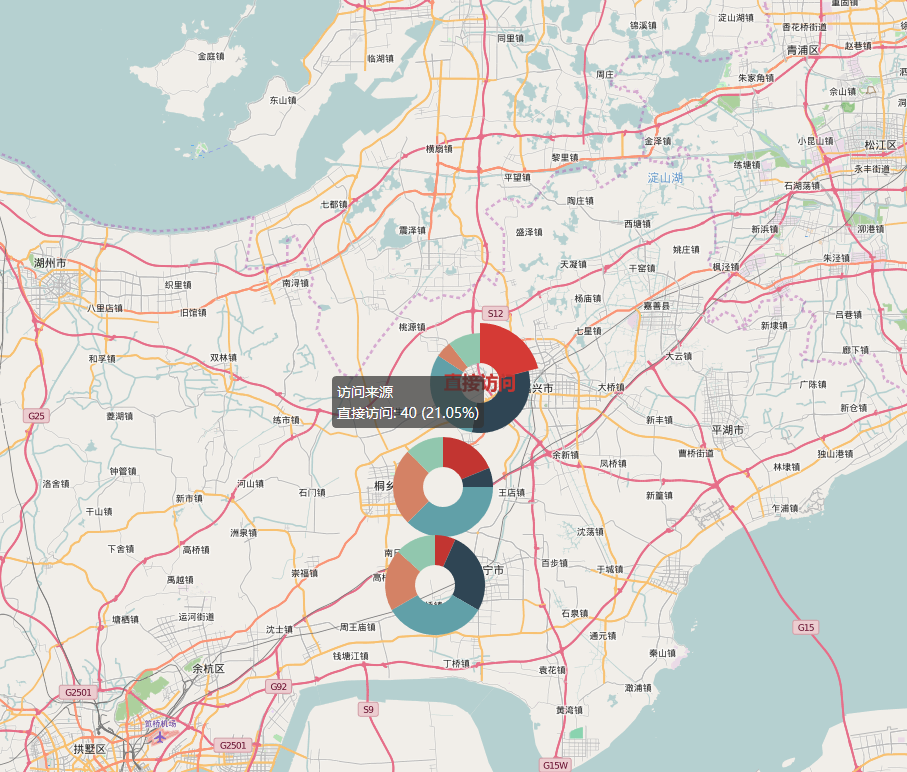
demo源码地址:https://github.com/shitao1988/leaflet-echartmarker
本文章转载自博客园Tobby
原文地址:https://www.cnblogs.com/shitao/p/5604652.html

转载自:https://blog.csdn.net/zjr201213136039/article/details/78974702