openlayers加载在线标准与自定义切片
目录
一、引言
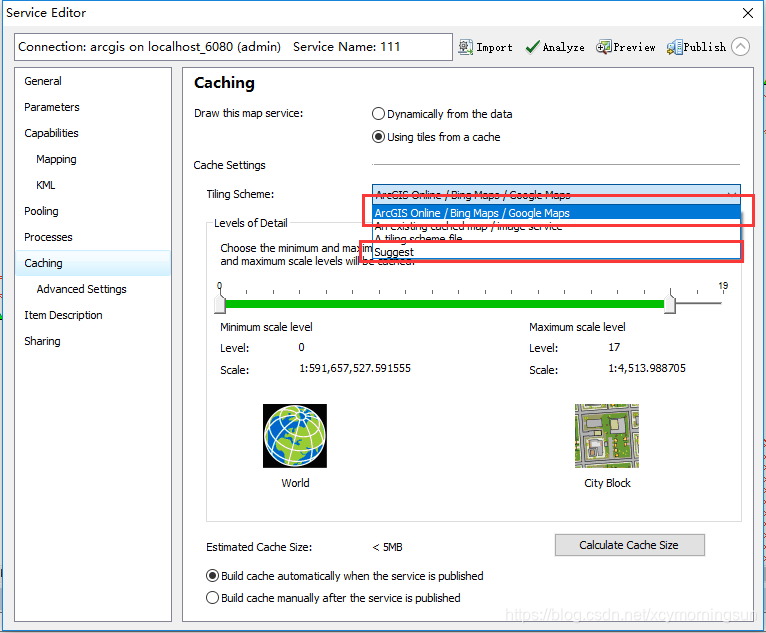
加载切片底图是openlayer最经常不过的功能,这篇文章先讲述了在线arcgis切片地图的加载,让读者有个基本的认识,下一节中会详细介绍加载切片的原理。分别是加载arcgis中的标准的切图方法和自定义的切图,标准的就是arcgisonline模式,有固定的分辨率,自定义的就是suggest模式。

二、在线标准切片
<!DOCTYPE html>
<html lang="en">
<head>
<meta charset="UTF-8">
<title>Title</title>
<link rel="stylesheet" href="js/ol.css">
<script src="lib/jquery/jquery-3.3.1.min.js"></script>
<script src="js/ol-debug.js"></script>
</head>
</head>
<body>
<div id="map"></div>
<script type="text/javascript">
var map = new ol.Map({
target: 'map',
layers: [
new ol.layer.Tile({
source: new ol.source.TileArcGISRest({
url: 'http://localhost:6080/arcgis/rest/services/test/cadcustom/MapServer'
})
})
],
view: new ol.View({
center: [509018, 299803],
zoom: 14,
projection: 'EPSG:3857'
})
});
map.on('click', function(evt) {
var coor=evt.coordinate;
alert(coor);
});
</script>
</body>
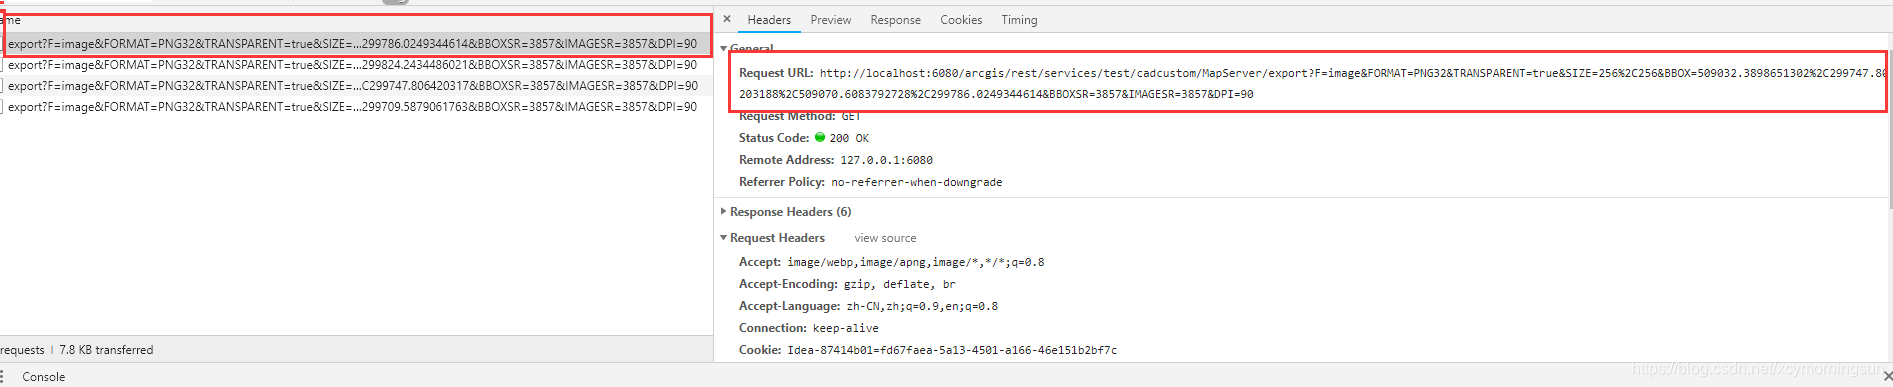
</html>在线标准切片比较简单,因为openlayers已经自己封装了针对arcgisrest服务的source接口,直接调用就可以。
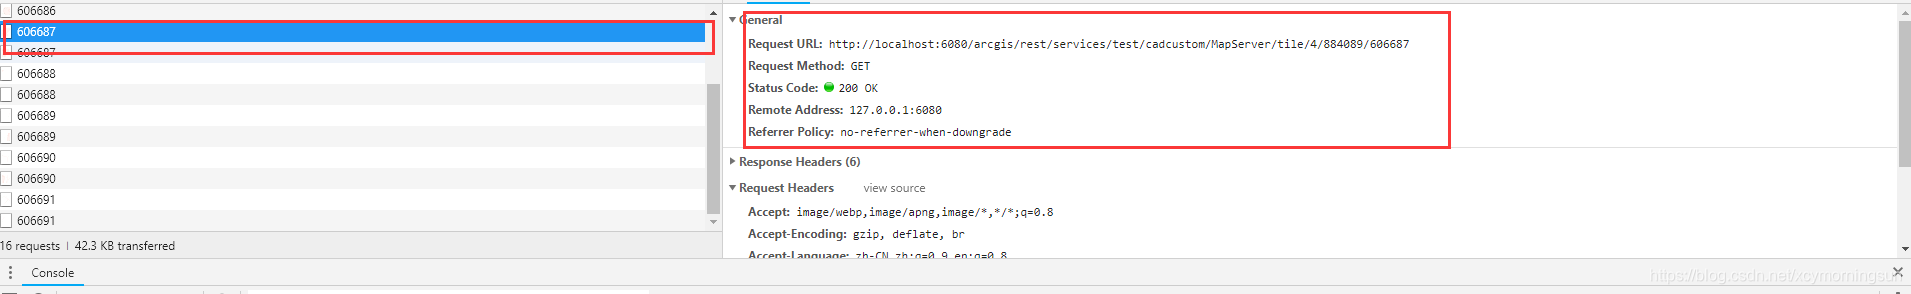
这里最终请求的服务详情为:

三、在线自定义切片
加载自定义切片底图涉及到几个概念,分辨率resolution、起始点origin、切片位置对应关系XYZ。
<!DOCTYPE html>
<html lang="en">
<head>
    <meta charset="UTF-8">
    <title>Title</title>
    <link rel="stylesheet" href="js/ol.css">
    <script src="lib/jquery/jquery-3.3.1.min.js"></script>
    <script src="js/ol.js"></script>

</head>
<body>
<div id="map" style="height: 100%;width: 98%"></div>
<script type="text/javascript">

    var projection = ol.proj.get('EPSG:3857');
    // 瓦片地址
    // 瓦片地址格式:http://localhost:6080/arcgis/rest/services/Test/Beijing/MapServer/tile/{z}/{y}/{x}
    var tileUrl = "http://localhost:6080/arcgis/rest/services/test/cadcustom/MapServer/tile/{z}/{y}/{x}";
    // 原点
    var origin = [ -2.00377E7 ,3.02411E7];
    // 分辨率
    var resolutions = [
        2.116670900008467,
        1.0583354500042335,
        0.5291677250021167,
        0.26458386250105836,
        0.13229193125052918,
        0.06614596562526459
    ];
    // 地图范围
    var fullExtent = [ 508609.7079405099,299415.4490000001,509204.2680308107,299922.62196192663];
    var tileGrid = new ol.tilegrid.TileGrid({
        tileSize: 256,
        origin: origin,
        extent: fullExtent,
        resolutions: resolutions
    });
    // 瓦片数据源
    var tileArcGISXYZ = new ol.source.XYZ({
        tileGrid: tileGrid,
        projection: projection,
        url: tileUrl
    });

    var map = new ol.Map({
        target: 'map',
        layers: [
            // 瓦片图层
            new ol.layer.Tile({
                source: tileArcGISXYZ
            })
        ],
        view: new ol.View({
            center:[509018, 299803],
            resolutions: resolutions,
            // 注意:此处指定缩放级别不能通过zoom来指定,指定了也无效,必须通过resolution来指定
            // 官方API说明:
            // Resolutions to determine the resolution constraint.
            // If set the maxResolution, minResolution, minZoom, maxZoom, and zoomFactor options are ignored.
            resolution: 1.0583354500042335,
            projection: projection,
            extent: fullExtent
        })
    });

     map.on('click', function(evt) {
         var coor=evt.coordinate;
         alert(coor);

     });

</script>

</body>
</html>
这里通过tileGrid重新定义了openlayers的瓦片坐标系,从而能加载自定义的在线切图,具体请求地址可见:
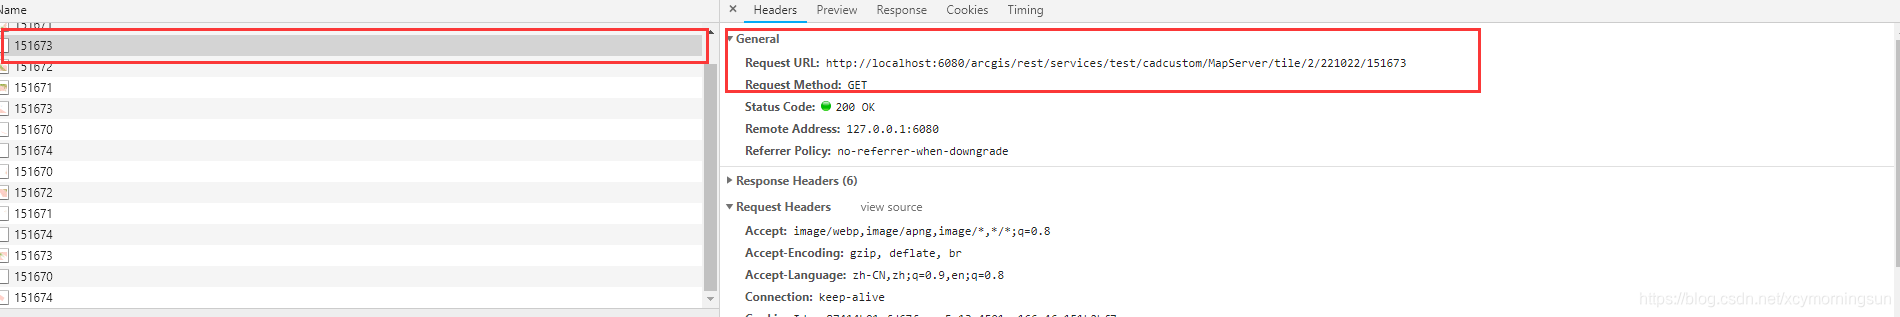

这里的请求地址url我们是怎么得来的呢?是通过arcgisserver中manager主页中通过arcgis JavaScript查看服务中得来的,从其中查看到请求方式也为这种格式,所以直接使用的:

四、总结
- 加载arcgis在线标准切片;
- 加载arcgis在线自定义切片;
转载自:https://blog.csdn.net/xcymorningsun/article/details/84027349