

openlayers4 自定义矢量图层的样式
目录
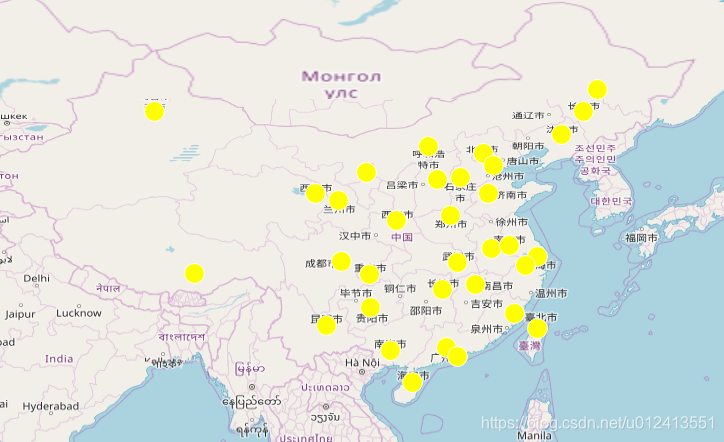
先看一个简单加载GeoJSON格式的矢量数据的方法。例如,现有一份全国各城市的点数据,要求将其以点形式展示在地图上。
文章目录
var mystyle = new ol.style.Style({
    	image: new ol.style.Circle({
    		radius: 10,
 		    fill: new ol.style.Fill({
            	color: '#ffff00'
        	})
    	})
    });
var vectorLayer = new ol.layer.Vector({
    source: new ol.source.Vector({
    	url: 'src/data/city.geojson',
    	format: new ol.format.GeoJSON()
    }),
    style: mystyle
});
var view = new ol.View({
    center: [114,34],
    zoom: 5,
    projection: 'EPSG:4326'
});

var controls = new ol.control.defaults();

var map = new ol.Map({
    layers:[vectorLayer],
    view: view,
    controls: controls,
    target: 'map'
})
上面代码中,第1句定义了一个ol.style.Style对象,然后在第2句定义了一个ol.layer.Vector(矢量图层)对象,并将第1句定义的style样式应用到图层上。style样式的应用非常灵活,为了加深记忆及方便使用,下面先简单记录下其用法。
点样式
形状-ol.style.Circle(圆点)
var style = new ol.style.Style({
    image: new ol.style.Circle({
        radius: 10,
        fill: new ol.style.Fill({
            color: '#ffff00',
        }),
        stroke: new ol.style.Stroke({
            color: '#fff',
            width: 1
        })
    })
});

图标-ol.style.Icon
var style = new ol.style.Style({
    image: new ol.style.Icon({
        anchor: [0.5, 1],
        src: '/icon/site1.png',//图标路径
        rotation: 0			//旋转角度
    })
});

标注样式 – ol.style.Text
var style = new ol.style.Text({
    font: '12px serif',	//字体及字体大小
    text: '西安',		//标注文字
    fill: new ol.style.Fill({
        color: '#000'
    })

线样式 – ol.style.Stroke
 var style = new ol.style.Style({
     stroke: new ol.style.Stroke({
         color: '#000000',
         width: 2
     })
 })

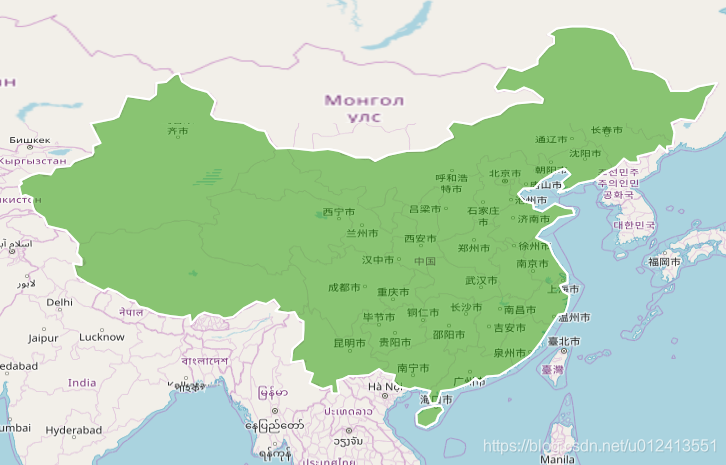
面样式 – ol.style.Fill
var style = new ol.style.Style({
    stroke: new ol.style.Stroke({
        color: '#fff',
        width: 2
    }),
    fill: new ol.style.Fill({
        color:[38,155,0,0.3]	//使用了一个数组,[r,g,b,a]
    })
})

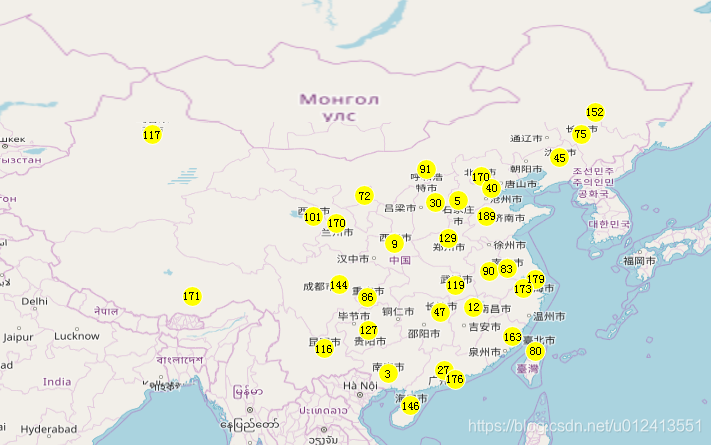
将要素的属性值应用到样式
ol.layer.Vector(矢量图层)对象的style属性,可以接受一个ol.style.Style对象或者sdfdf,也可以接受一个ol.styleFunction函数对象。ol.styleFunction可以将矢量图层的feature作为参数传入函数内部,从而可以获得feature上的属性值并应用到样式中。
function styleFunc(feature){
    var style = new ol.style.Style({
        image: new ol.style.Circle({
            radius: 10,
            fill: new ol.style.Fill({
                color: '#ffff00',
            }),
            stroke: new ol.style.Stroke({
                color: '#fff',
                width: 1
            })
        }),
        text: new ol.style.Text({
            font: '12px serif',
            text: feature.get('AQI').toString(),
            fill: new ol.style.Fill({
                color: '#000'
            })
        })
    });
    return style;
}
完整测试代码如下
js代码:
var baseLayer = new ol.layer.Tile({
source: new ol.source.OSM()
});
var vectorLayer = new ol.layer.Vector({
source: new ol.source.Vector()
});
var view = new ol.View({
center: [114,34],
zoom: 5,
projection: 'EPSG:4326'
});
var controls = new ol.control.defaults();
var map = new ol.Map({
layers:[baseLayer,vectorLayer],
view: view,
controls: controls,
target: 'map'
})
/**
* 点样式
*/
function showPoint(){
var style = new ol.style.Style({
image: new ol.style.Circle({
radius: 10,
fill: new ol.style.Fill({
color: '#ffff00',
}),
stroke: new ol.style.Stroke({
color: '#fff',
width: 1
})
})
});
$.getJSON('/data/p_province_air_test.geojson',function(data){
var features = new ol.format.GeoJSON().readFeatures(data);
vectorLayer.getSource().clear();
vectorLayer.getSource().addFeatures(features);
vectorLayer.setStyle(style);
})
}
/**
* 标注样式
*/
function showPointLabel(){
function styleFunc(feature){
var style = new ol.style.Style({
image: new ol.style.Circle({
radius: 10,
fill: new ol.style.Fill({
color: '#ffff00',
}),
stroke: new ol.style.Stroke({
color: '#fff',
width: 1
})
}),
text: new ol.style.Text({
font: '12px serif',
text: feature.get('AQI').toString(),
fill: new ol.style.Fill({
color: '#000'
})
})
});
return style;
}
$.getJSON('/data/p_province_air_test.geojson',function(data){
var features = new ol.format.GeoJSON().readFeatures(data);
vectorLayer.getSource().clear();
vectorLayer.getSource().addFeatures(features);
vectorLayer.setStyle(styleFunc);
})
}
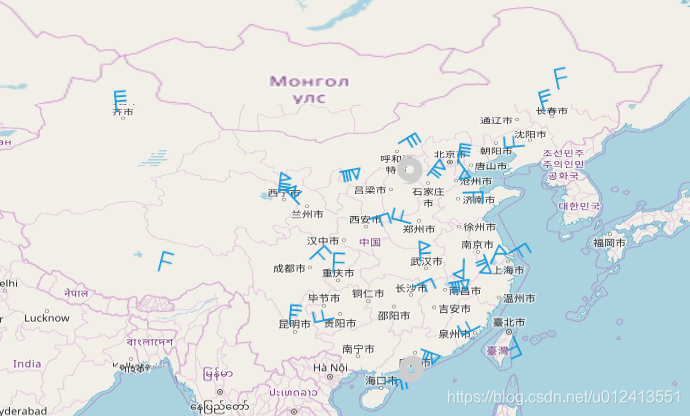
/**
* 图标样式
*/
function showIcon(){
//图标列表
var icons = [];
for(var i = 1; i < 13;i++){
icons.push('/icon/level' + i.toString() + '.png');
}
function styleFunc(feature){
var power = feature.get('windpower');
if(power === 0 || power >12){
return null;
}
var style = new ol.style.Style({
image: new ol.style.Icon({
anchor: [0.5, 1],
src: icons[power - 1],//不同风力图标
rotation: feature.get('winddirection')
})
});
return style;
}
$.getJSON('/data/p_province_air_test.geojson',function(data){
var features = new ol.format.GeoJSON().readFeatures(data);
vectorLayer.getSource().clear();
vectorLayer.getSource().addFeatures(features);
vectorLayer.setStyle(styleFunc);
})
}
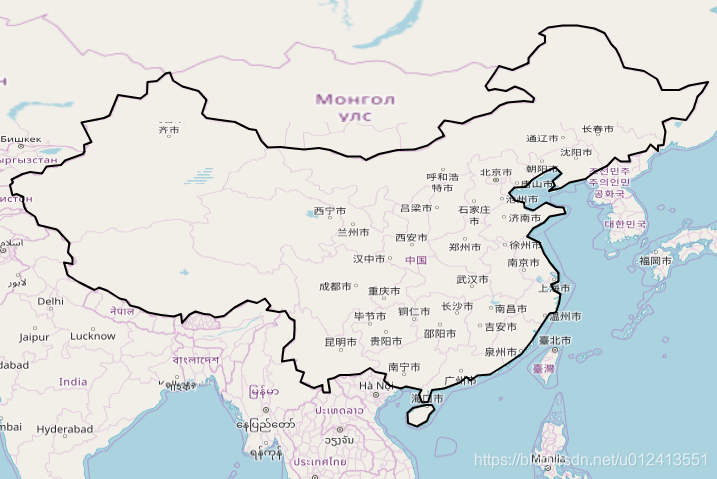
/**
* 边线样式
*/
function showStroke(){
var style = new ol.style.Style({
stroke: new ol.style.Stroke({
color: '#000000',
width: 2
})
})
$.getJSON('/data/r_china.geojson',function(data){
var features = new ol.format.GeoJSON().readFeatures(data);
vectorLayer.getSource().addFeatures(features);
vectorLayer.setStyle(style);
})
}
/**
* 填充样式及边线
*/
function showFill(){
var style = new ol.style.Style({
stroke: new ol.style.Stroke({
color: '#fff',
width: 2
}),
fill: new ol.style.Fill({
color:[38,155,0,0.3]
})
})
$.getJSON('/data/r_china.geojson',function(data){
var features = new ol.format.GeoJSON().readFeatures(data);
vectorLayer.getSource().addFeatures(features);
vectorLayer.setStyle(style);
})
}
html代码
<!DOCTYPE html>
<html lang="en">
<head>
    <meta charset="UTF-8">
    <meta name="viewport" content="width=device-width, initial-scale=1.0">
    <meta http-equiv="X-UA-Compatible" content="ie=edge">
    <link rel="stylesheet" href="/js/source/ol4/v4.6.5-dist/ol.css" />
    <title>Document</title>
    <style>
        html,body,#map{
            width: 100%;
            height: 100%;
            border: 0pc;
            background-color: black
        }
    </style>
    <script src="/js/source/jquery/jquery-3.3.1.min.js"></script>
    <script src="/js/source/ol4/v4.6.5-dist/ol.js"></script>
</head>
<body>
    <div>
        <button id = "point" onclick="showPoint()">点</button>
        <button id = "label" onclick="showPointLabel()">标注</button>
        <button id = "label" onclick="showIcon()">图标</button>
        <button id = "line" onclick="showStroke()">线</button>
        <button id = "polygon" onclick="showFill()">面</button>
    </div>
    <div id="map"></div>
    <script src="/js/stydy/ts-style.js"></script>
</body>
</html>
转载自:https://blog.csdn.net/u012413551/article/details/87303530


