

openlayers3同时加载矢量地图和卫星地图
我使用的是geoserver地图服务,有个项目需要将矢量地图和卫星地图一起显示出来,网上查了一遍,后自己又研究了下,现总结出来。
openlayers3是一个专为Web GIS 客户端开发提供的JavaScript 类库包,用于实现标准格式发布的地图数据访问。
代码如下:
            var format = 'image/png';
            var projection = new ol.proj.Projection({
                code : 'EPSG:3857',
                units : 'm',
                axisOrientation : 'neu'
            });
            var tiledParams = {
                LAYERS : 'gmws:china_province', //矢量图层名称
                FORMAT : format,
                VERSION : '1.1.1',
                STYLES : '',
            };
            var tiled = new ol.layer.Image({
                opacity : 1,
                visible : true,
                source : new ol.source.ImageWMS({
                    url : 'http://127.0.0.1:8080/geoserver/gmws/wms',   //矢量地图url路径
                    params : tiledParams,
                })
            });
            var gr = new ol.tilegrid.TileGrid({
                origin : [ -180.0,-90.0, 180, 90 ],
                resolutions : [156543.03390625, 78271.516953125, 39135.7584765625, 19567.87923828125,
152.87405654907226, 76.43702827453613, 38.218514137268066, 19.109257068634033,
9.554628534317017, 4.777314267158508]  //卫星地图显示等级:0-15级(web墨卡托投影方式)
            });
            var sichuanTifLayer = new ol.layer.Tile({
                source : new ol.source.TileWMS({
                    url : 'http://127.0.0.1:8080/geoserver/gwc/service/wms',  //卫星地图url路径
                    params : {
                        'FORMAT' : 'image/png',
                        'VERSION' : '1.1.1',
                        'SRS' : 'EPSG:3857',
                        'tiled' : true,
                        'LAYERS' : 'gmws:sichuan_province',
                    },
                    tileGrid : gr,
                    serverType: 'geoserver'
                })
            });
            map = new ol.Map({
                interactions : ol.interaction.defaults({
                    doubleClickZoom : false,
                }),
                view : new ol.View({
                    projection : projection,
                    center : ol.proj.transform([ 107.1, 35.82 ], 'EPSG:4326', 'EPSG:3857'),
                    zoom : 8,
                    minZoom : 3,
                    maxZoom : 13
                }),
                layers : [
                          sichuanTifLayer,
                          tiled
                         ],//注意:矢量地图不要填充色,不然会遮住卫星地图(两个图层可以交换顺序)
                target : 'map'
            });
显示效果如下:
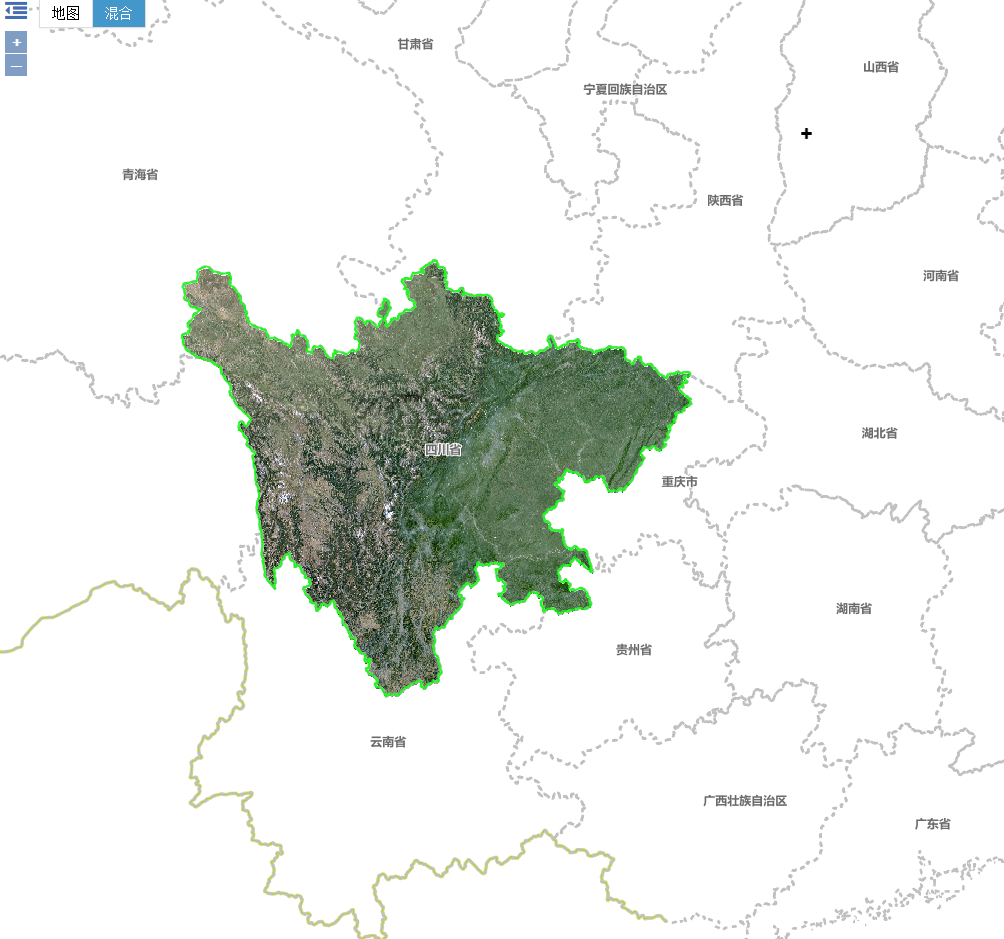

单独控制卫星地图显示/隐藏:
sichuanTifLayer.setVisible(false); //true/false转载自:https://blog.csdn.net/Wang_xin_yu/article/details/60956087


