

OpenLayers3显示PostGIS中的数据
目录
环境为PostGIS+GeoServer+OpenLayers3
首先介绍一下直接写好GeoJSON进行矢量图层显示的例子,参考examples里的geojson.html和icon.html
一、直接用geojson显示矢量图层
        var BSIconStyle = new ol.style.Style({  /*icon样式*/
            image: new ol.style.Icon(/** @type {olx.style.IconOptions} */({
                opacity: 0.95,
                src: 'data/bs2.png'
            }))
        });
        var BSLayer = new ol.layer.Vector({ /*图标图层*/
            source: new ol.source.GeoJSON({
                projection: 'EPSG:3857',
                object:
                {
                    "type": "FeatureCollection",
                    "features": [
	{ "type": "Feature",
	    "geometry": { "type": "Point", "coordinates": [121.50, 31.22] },
	    "properties": { "name": "bs1" }
	},
	{ "type": "Feature",
	    "geometry": { "type": "Point", "coordinates": [121.52, 31.10] },
	    "properties": { "name": "bs2" }
	},
    { "type": "Feature",
        "geometry": { "type": "Point", "coordinates": [121.38, 31.24] },
        "properties": { "name": "bs3" }
    },
	{ "type": "Feature",
	    "geometry": { "type": "Point", "coordinates": [121.47, 31.29] },
	    "properties": { "name": "bs4" }
	},
	{ "type": "Feature",
	    "geometry": { "type": "Point", "coordinates": [121.43, 31.21] },
	    "properties": { "name": "bs5" }
	}
]
                }
            }),
            style: BSIconStyle
        });
var map = new ol.Map({
target: 'map',
controls: ol.control.defaults().extend([new ol.control.ScaleLine()/*比例尺*/]),
layers: [
new ol.layer.Tile({
source: new ol.source.OSM(),
extent: ol.proj.transformExtent([120.50, 30.79, 122.50, 31.64], 'EPSG:4326', 'EPSG:3857') /*图层渲染范围*/
}),
BSLayer
],
view: new ol.View({
center: ol.proj.transform([121.50, 31.22], 'EPSG:4326', 'EPSG:3857'),
zoom: 11,
minZoom: 10
})
});
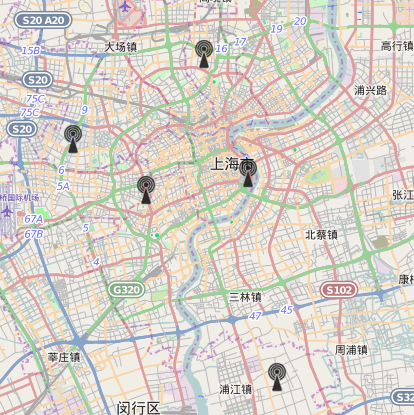
显示结果如下:

二、将数据存在PostGIS中然后发布到GeoServer然后用OpenLayers3显示
1.将数据存入PostGIS
创建PostGIS数据库、创建表等详情可见http://live.osgeo.org/zh/quickstart/postgis_quickstart.html
因为之前已经有了osm数据库(见之前配置的那篇文章),所以这里直接创建表。
(1)表spatial_ref_sys 存储着合法的空间坐标系统,我这里只有osm的900913,所以要插入EPSG:4326,如果有的话就不用插入了,如何插入可以在这里查询到http://spatialreference.org/ref/epsg/4326/,这里也可以查询其他坐标系,点击PostGIS
spatial_ref_sys INSERT statement可以得到插入语句:
INSERT into spatial_ref_sys (srid, auth_name, auth_srid, proj4text, srtext) values ( 94326, 'epsg', 4326, '+proj=longlat +ellps=WGS84 +datum=WGS84 +no_defs ', 'GEOGCS["WGS 84",DATUM["WGS_1984",SPHEROID["WGS 84",6378137,298.257223563,AUTHORITY["EPSG","7030"]],AUTHORITY["EPSG","6326"]],PRIMEM["Greenwich",0,AUTHORITY["EPSG","8901"]],UNIT["degree",0.01745329251994328,AUTHORITY["EPSG","9122"]],AUTHORITY["EPSG","4326"]]');(2)创建一个存储有关数据信息的基站表,id是主键,有name以及radius两个属性。
CREATE TABLE basestations ( id int4 primary key, name varchar(50),radius float8 );(3)现在添加一个空间栏用于存储地理位置。习惯上这个栏目叫做 the_geom 。它记录了数据为什么类型(点、线、面)、有几维(这里是二维)以及空间坐标系统。此处使用 EPSG:4326 坐标系统(使用900913在OpenLayers中显示的位置不对,改为4326就ok了,因为在插入数据的时候插入的是4326的坐标系)
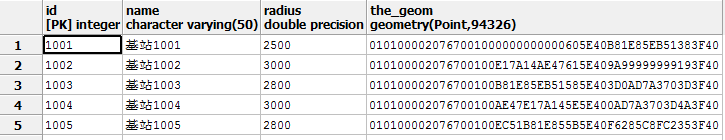
SELECT AddGeometryColumn ('basestations', 'the_geom', 94326, 'POINT', 2);(4)往表中插入5条数据
INSERT INTO basestations (id, the_geom, name, radius) VALUES (1001,ST_GeomFromText('POINT(121.50 31.22)',94326),'基站1001',2500);
INSERT INTO basestations (id, the_geom, name, radius) VALUES (1002,ST_GeomFromText('POINT(121.52 31.10)',94326),'基站1002',3000);
INSERT INTO basestations (id, the_geom, name, radius) VALUES (1003,ST_GeomFromText('POINT(121.38 31.24)',94326),'基站1003',2800);
INSERT INTO basestations (id, the_geom, name, radius) VALUES (1004,ST_GeomFromText('POINT(121.47 31.29)',94326),'基站1004',3000);
INSERT INTO basestations (id, the_geom, name, radius) VALUES (1005,ST_GeomFromText('POINT(121.43 31.21)',94326),'基站1005',2800);
数据库这里就完成了

2.发布到GeoServer
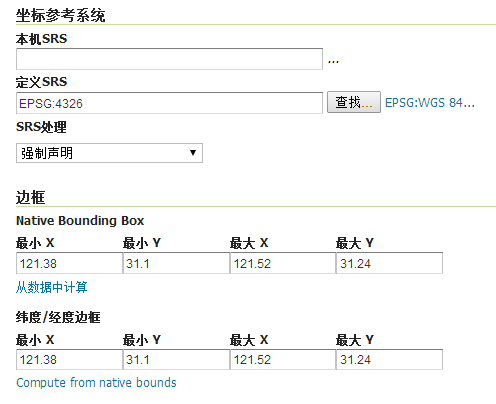
(1)和之前发布的过程是一样的,就不说,但是有一点需要注意,发布时SRS要设为4326,不能是900913
(2)为了能够让OpenLayers以矢量图层显示并且用JSONP跨域使用,需要让GeoServer允许JSONP的格式,需要更改geoserver的web.xml,我的位置是在D:\Program Files (x86)\GeoServer 2.7.0\webapps\geoserver\WEB-INF\web.xml,要将这里原本的注释给去掉。

<!–Can be true or false (defaults to: false). –>
<!–When true the JSONP (text/javascript) output format is enabled –>
<context-param>
<param-name>ENABLE_JSONP</param-name>
<param-value>true</param-value>
</context-param>
3.用OpenLayers3显示
var BSIconStyle = new ol.style.Style({  /*icon样式*/
    image: new ol.style.Icon(/** @type {olx.style.IconOptions} */({
        opacity: 0.95,
        src: 'data/bs2.png'
    }))
});
var BSSource = new ol.source.ServerVector({
    format: new ol.format.GeoJSON(),
    loader: function (extent, resolution, projection) {
        var url = 'http://localhost:8080/geoserver/osmtest/ows?service=WFS&' +
        'version=1.0.0&request=GetFeature&typeName=osmtest:basestations&' +
        '&outputFormat=text/javascript&format_options=callback:loadFeatures' +
        '&srsname=EPSG:3857&bbox=' + extent.join(',') + ',EPSG:3857';
        $.ajax({
            url: url,
            dataType: 'jsonp'
        });
    },
    strategy: ol.loadingstrategy.createTile(new ol.tilegrid.XYZ({
        maxZoom: 19
    })),
    projection: 'EPSG:3857'
});
var loadFeatures = function (response) {
    BSSource.addFeatures(BSSource.readFeatures(response));
};
var BSLayer = new ol.layer.Vector({
    source: BSSource,
    style: BSIconStyle
});
之前尝试过使用GML或者application/json的ouputFormat,但是都不成功,不知道别人为什么能成功,最后只是用这种方式实现了。
转载自:https://blog.csdn.net/hyj_13/article/details/45643559


