

OpenLayers之图形绘制二:绘制几何图形
目录
目录
一、根据已有的空间坐标信息绘制图形
编写代码,通过一个矢量图层分别加载单个点、线、多边形矢量要素。
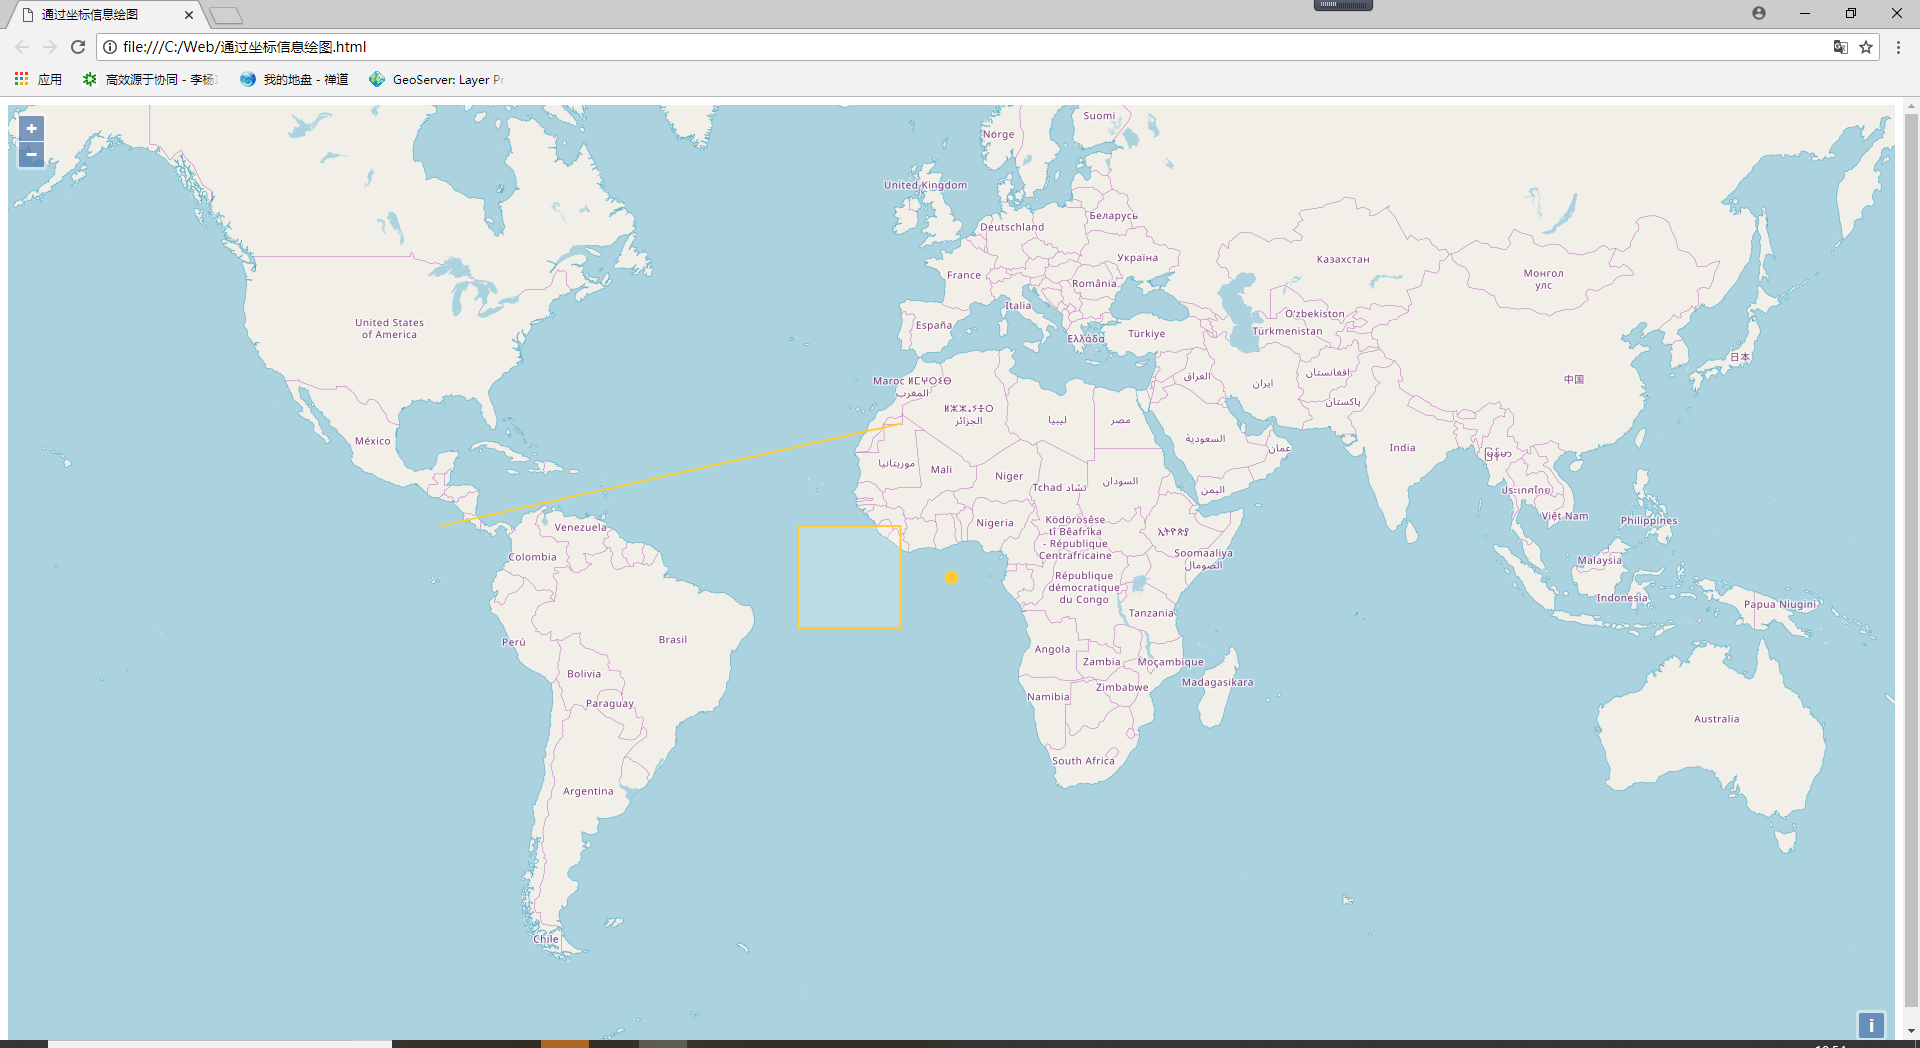

代码如下:
<body>
    <div id="map"></div>

    <script>
        var map = new ol.Map({
            target: 'map',
            layers: [
                new ol.layer.Tile({
                    source: new ol.source.OSM()
                })
            ],
            view: new ol.View({
                center: [0, 0],
                zoom: 3
            })
        })
        //点要素
        var pointFeature = new ol.Feature(
            new ol.geom.Point([0, 0])
        );
        //线要素
        var lineFeature = new ol.Feature(
            new ol.geom.LineString(
                [
                    [-1e7, 1e6],
                    [-1e6, 3e6]
                ]
            )
        );
        //多边形要素
        var polygonFeature = new ol.Feature(
            new ol.geom.Polygon(
                [
                    [
                        [-3e6, -1e6],
                        [-3e6, 1e6],
                        [-1e6, 1e6],
                        [-1e6, -1e6],
                        [-3e6, -1e6]
                    ]
                ]
            )
        );
        //实例化一个矢量图层Vector作为绘制层
        var source = new ol.source.Vector({
            features: [
                pointFeature,
                lineFeature,
                polygonFeature
            ]
        });
        var vectorLayer = new ol.layer.Vector({
            source: source,
            style: new ol.style.Style({
                fill: new ol.style.Fill({               //填充样式
                    color: 'rgba(255, 255, 255, 0.2'
                }),
                stroke: new ol.style.Stroke({           //线样式
                    color: '#ffcc33',
                    width: 2
                }),
                image: new ol.style.Circle({            //点样式
                    radius: 7,
                    fill: new ol.style.Fill({
                        color: '#ffcc33'
                    })
                })
            })
        });
        //将绘制层添加到地图容器中
        map.addLayer(vectorLayer);
    </script>
</body>
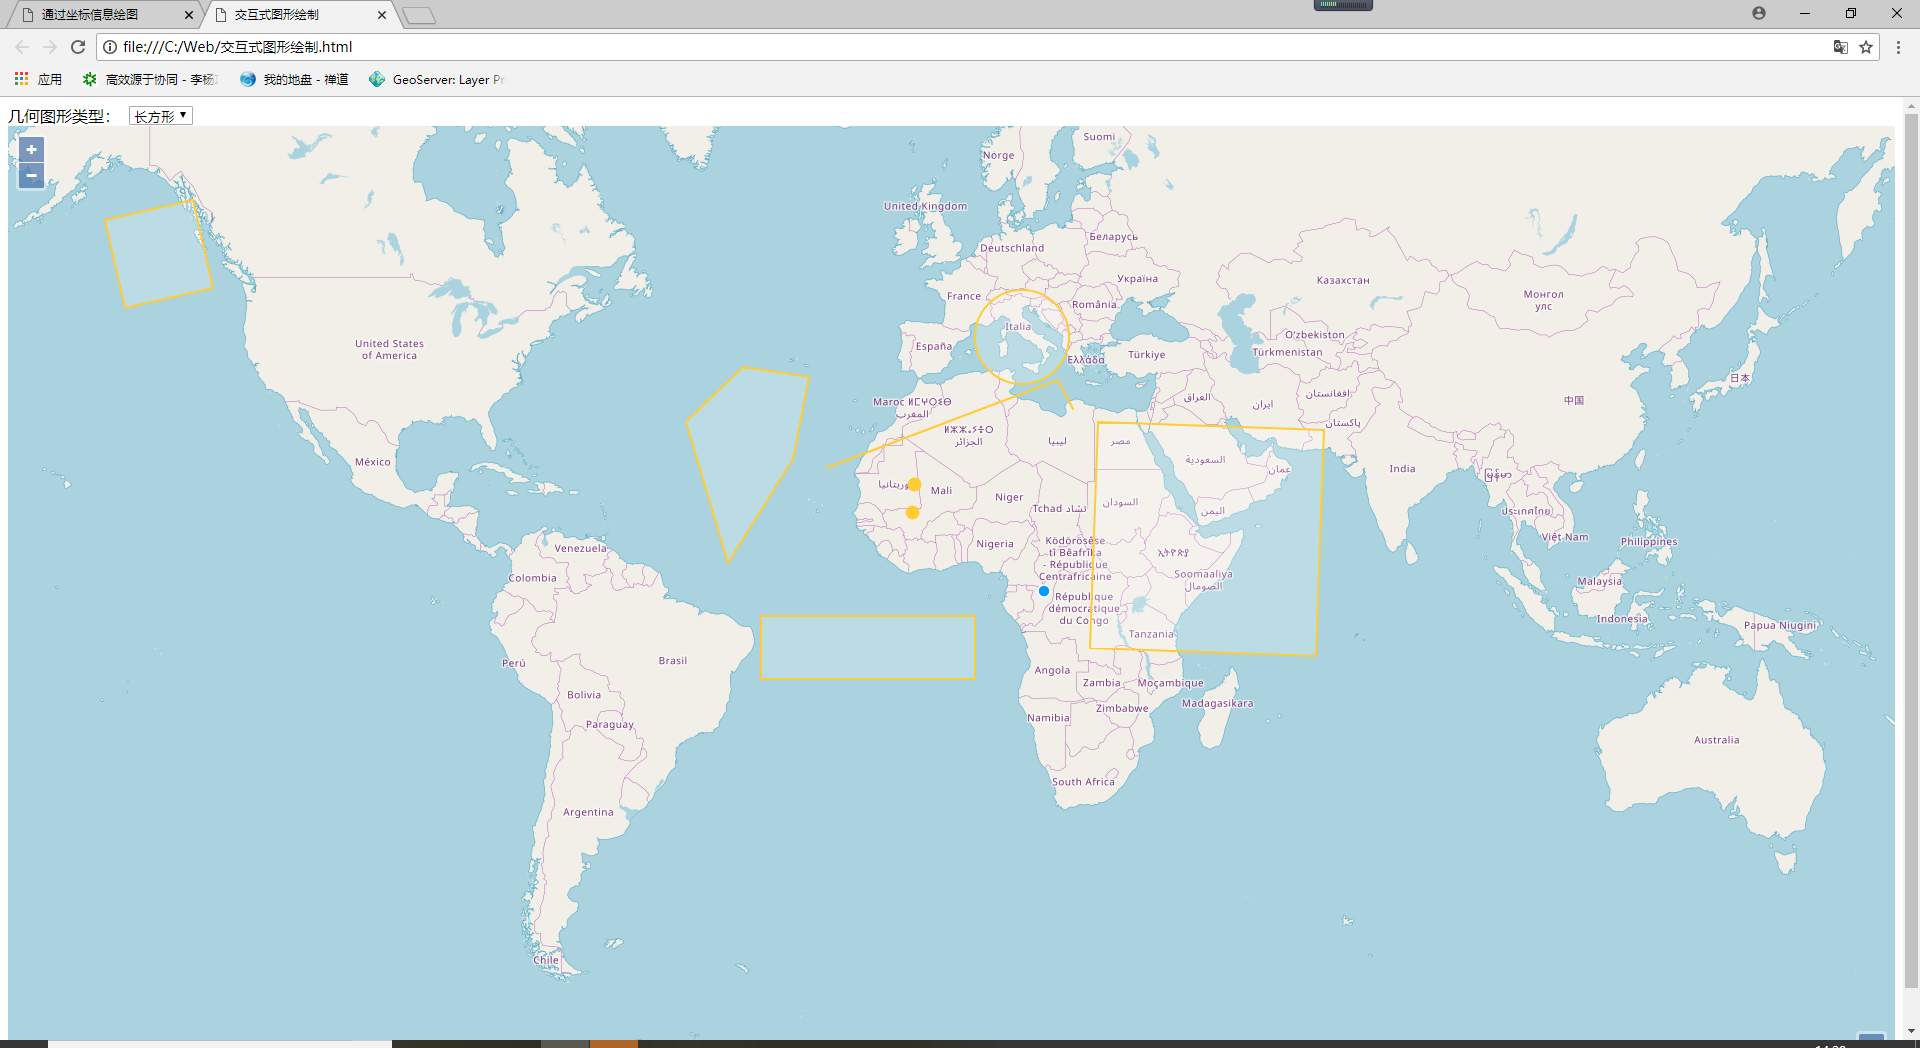
二、交互式图形绘制
根据设置的几何图形类型交互绘制图形
代码如下:
<body>
<div id="menu">
<label>几何图形类型: </label>
<select id="type">
<option value="None">无</option>
<option value="Point">点</option>
<option value="LineString">线</option>
<option value="Polygon">多边形</option>
<option value="Circle">圆</option>
<option value="Square">正方形</option>
<option value="Box">长方形</option>
</select>
</div>
<div id="map"></div>
<script>
var map = new ol.Map({
target: 'map',
layers: [
new ol.layer.Tile({
source: new ol.source.OSM()
})
],
view: new ol.View({
center: [0, 0],
zoom: 3
})
});
var typeSelect = document.getElementById('type'); //绘制类型选择对象
var draw; //ol.Interaction.Draw类的对象
//实例化一个矢量图层Vector作为绘制层
var source = new ol.source.Vector();
var vectorLayer = new ol.layer.Vector({
source: source,
style: new ol.style.Style({
fill: new ol.style.Fill({ //填充样式
color: 'rgba(255, 255, 255, 0.2'
}),
stroke: new ol.style.Stroke({ //线样式
color: '#ffcc33',
width: 2
}),
image: new ol.style.Circle({ //点样式
radius: 7,
fill: new ol.style.Fill({
color: '#ffcc33'
})
})
})
});
//将绘制层添加到地图容器中
map.addLayer(vectorLayer);
//用户更改绘制类型触发的事件
typeSelect.onchange = function(e){
map.removeInteraction(draw); //移除绘制图形控件
addInteraction(); //添加绘制图形控件
};
function addInteraction(){
var typeValue = typeSelect.value; //绘制类型
if(typeValue !== 'None'){
var geometryFunction, maxPoints;
if(typeValue === 'Square'){ //正方形
typeValue = 'Circle'; //设置绘制类型为Circle
//设置几何信息变更函数,即创建正方形
geometryFunction = ol.interaction.Draw.createRegularPolygon(4);
}else if(typeValue === 'Box'){ //长方形
typeValue = 'LineString'; //设置绘制类型为LineString
maxPoints = 2; //设置最大点数为2
//设置几何信息变更函数,即设置长方形的坐标点
geometryFunction = function(coordinates, geometry){
if(!geometry){
geometry = new ol.geom.Polygon(null); //多边形
}
var start = coordinates[0];
var end = coordinates[1];
geometry.setCoordinates([
[
start,
[start[0], end[1]],
end,
[end[0], start[1]],
start
]
]);
return geometry;
};
}
console.log(typeValue);
//实例化图形绘制控件对象并添加到地图容器中
draw = new ol.interaction.Draw({
source: source,
type: typeValue, //几何图形类型
geometryFunction: geometryFunction, //几何信息变更时的回调函数
maxPoints: maxPoints //最大点数
});
map.addInteraction(draw);
}else{
//清空绘制的图形
source.clear();
}
}
</script>
</body>
在本示例中,加载一个矢量图层绘制vector,在实例化此图层对象时统一设置了绘制的几何图形样式,然后通过调用addInteraction()函数加载交互绘制图形控件(ol.interaction.Draw),实现基本几何图形的绘制功能。
交互绘制几何图形的关键是实例化ol.interaction.Draw控件,设置其关键参数,并将此控件添加到地图容器中。直接支持点、线、圆、多边形图形,在创建交互控件时,直接设置控件对象的type参数即可;除此之外,正方形和长方形图形作为规则多边形,需要通过geometryFunction参数单独处理。
ol.interaction.Draw的主要参数:
1. source: 绘制图层的数据源,即承载几何图形要素的数据源。
2. type:绘制的几何图形类型,即ol.geom.GeometryType,包括Point、LineString、Polygon、MultiPoint、MultiLineString、MultiPolygon、Circle。
3. geometryFunction:当几何坐标更新时调用此函数,在此当绘制类型为“正方形”和“长方形”时,需要通过此函数设置其几何对象。所以“正方形”时通过ol.interaction.Draw.createRegularPolygon(4)创建该函数,为“长方形”时则调用多边形(ol.geom.Polygon)的setCoordinates方法设置多边形的几何坐标串。
4. maxPoints:绘制图形结束前多边形或线的最大点数,线默认为2,多边形默认为3。
转载自:https://blog.csdn.net/qq_35732147/article/details/81663019


