

Canvas Tiles——Canvas瓦片

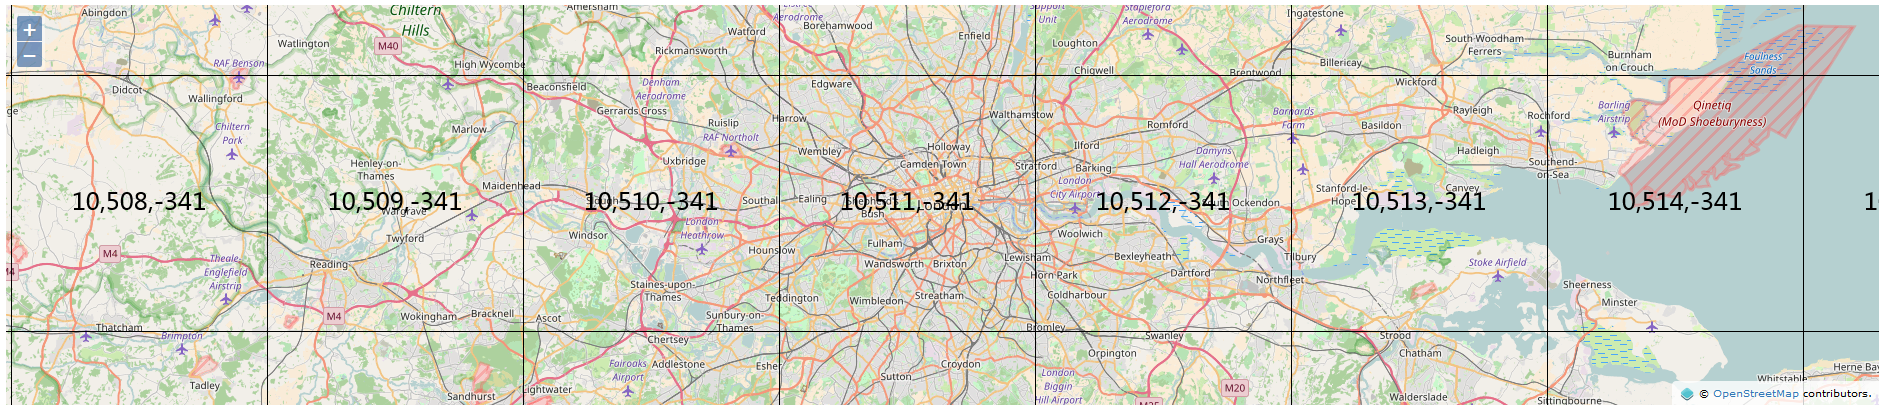
The black grid tiles are generated on the client with an HTML5 canvas. The displayed tile coordinates are OpenLayers tile coordinates. These increase from bottom to top, but standard XYZ tiling scheme coordinates
increase from top to bottom. To calculate the
黑色网格瓦片是在客户端用HTML5 canvas产生的。显示的瓦片坐标是Openlayers的坐标。这些瓦片坐标是从下往上增加的,但是标准的XYZ瓦片坐标是从上往下增加的。为了计算标准的XYZ瓦片坐标的y,使用-y-1。
increase from top to bottom. To calculate the
y for a standard XYZ tile coordinate, use-y - 1.黑色网格瓦片是在客户端用HTML5 canvas产生的。显示的瓦片坐标是Openlayers的坐标。这些瓦片坐标是从下往上增加的,但是标准的XYZ瓦片坐标是从上往下增加的。为了计算标准的XYZ瓦片坐标的y,使用-y-1。
代码:
<!DOCTYPE html>
<html>
  <head>
    <title>Canvas Tiles</title>
    <link rel="stylesheet" href="https://openlayers.org/en/v4.2.0/css/ol.css" type="text/css">
    <!-- The line below is only needed for old environments like Internet Explorer and Android 4.x -->
    <script src="https://cdn.polyfill.io/v2/polyfill.min.js?features=requestAnimationFrame,Element.prototype.classList,URL"></script>
    <script src="https://openlayers.org/en/v4.2.0/build/ol.js"></script>
  </head>
  <body>
    <div id="map" class="map"></div>
    <script>
      var osmSource = new ol.source.OSM();
      var map = new ol.Map({
        layers: [
          new ol.layer.Tile({
            source: osmSource
          }),
          new ol.layer.Tile({
            // 显示瓦片的行列号
            source: new ol.source.TileDebug({
              projection: 'EPSG:3857',
              tileGrid: osmSource.getTileGrid()
            })
          })
        ],
        target: 'map',
        controls: ol.control.defaults({
          attributionOptions: /** @type {olx.control.AttributionOptions} */ ({
            collapsible: false
          })
        }),
        view: new ol.View({
          center: ol.proj.transform(
              [-0.1275, 51.507222], 'EPSG:4326', 'EPSG:3857'),
          zoom: 10
        })
      });
    </script>
  </body>
</html>转载自:https://blog.csdn.net/SmileCoffin/article/details/73839380


