OpenLayers官方示例详解二:Drag-and-Drop Image Vector
目录
目录
一、示例概述
本示例实现了从文件夹中拖拉文件到浏览器从而加载地理数据的功能,地理数据是以图片的形式展示在浏览器。
二、代码详解
2.1、创建DragAndDrop控件并添加到地图
        var dragAndDropInteraction = new ol.interaction.DragAndDrop({
            formatConstructors: [                               //支持加载的地理数据的格式
                ol.format.GPX,
                ol.format.GeoJSON,
                ol.format.IGC,
                ol.format.KML,
                ol.format.TopoJSON
            ]
        });

        var map = new ol.Map({
            //添加控件到地图
            interactions: ol.interaction.defaults().extend([dragAndDropInteraction]),
            layers: [
                new ol.layer.Tile({
                    source: new ol.source.OSM()
                })
            ],
            target: 'map',
            view: new ol.View({
                center: [0, 0],
                zoom: 2
            })
        });
OpenLayers提供了ol/interaction/DragAndDrop类来支持从文件夹中直接拖拉文件数据加载到地图上。
formatConstructors参数用于设置支持加载的地理数据的格式。
2.2、设置数据文件拖拉到浏览器后执行的操作
        dragAndDropInteraction.on('addfeatures', function(event){   //当文件数据拖拉到浏览器时触发该事件
            var vectorSource = new ol.source.Vector({        //设置数据源
                features: event.features
            });
            map.addLayer(new ol.layer.Vector({              //初始化矢量图层并添加到地图
                renderMode: 'image',            //矢量图层渲染为图片
                source: vectorSource,
                style: styleFunction            //矢量图层的样式
            }));
            map.getView().fit(vectorSource.getExtent());    //视图缩放至新添加的矢量要素
        });
先为DragAndDrop控件绑定了”addfeatures“事件的处理程序,该事件会在文件数据拖拉到浏览器时触发。
事件的处理程序主要功能是将文件数据装载至矢量图层并添加到地图中。
可以看到,ol.layer.Vector类的style参数使用了样式函数的形式设置矢量图层的样式,接下来介绍该样式函数。
2.3、样式函数
查看OpenLayers的官方API可以看到ol.layer.Vector类的style参数可以接受三种类型的参数,其中一种是styleFunction(样式函数)。

本示例就是通过设置style参数为一个样式函数来渲染矢量图层的样式。
继续查看styleFunction的API,可以看到styleFunction()接受两个参数:
- ol/Feature —— 矢量图层的要素
- resolution —— 地图分辨率(屏幕上面的1像素相对于地面的实际距离)
了解了上面这些内容后,我们再来看本示例的样式函数:
        var defaultStyle = {
            //点样式
            'Point': new ol.style.Style({
                image: new ol.style.Circle({
                    fill: new ol.style.Fill({
                        color: 'rgba(255, 255, 0, 0.5)'
                    }),
                    radius: 5,
                    stroke: new ol.style.Stroke({
                        color: '#FF0',
                        width: 1
                    })
                })
            }),
            //线样式
            'LineString': new ol.style.Style({
                stroke: new ol.style.Stroke({
                    color: '#F00',
                    width: 3
                })
            }),
            //多变形样式
            'Polygon': new ol.style.Style({
                fill: new ol.style.Fill({
                    color: 'rgba(0, 255, 255, 0.5)'
                }),
                stroke: new ol.style.Stroke({
                    color: '#0FF',
                    width: 1
                })
            }),
            //多点样式
            "MultiPoint": new ol.style.Style({
                image: new ol.style.Circle({
                    fill: new ol.style.Fill({
                        color: 'rgba(255, 0, 255, 0.5)'
                    }),
                    radius: 5,
                    stroke: new ol.style.Stroke({
                        color: '#F0F',
                        width: 1
                    })
                })
            }),
            //多线样式
            'MultiLineString': new ol.style.Style({
                stroke: new ol.style.Stroke({
                    color: "#0f0",
                    width: 3
                })
            }),
            //多多边形样式
            'MultiPolygon': new ol.style.Style({
                fill: new ol.style.Fill({
                    color: 'rgba(0, 0, 255, 0.5)'
                }),
                stroke: new ol.style.Stroke({
                    color: '#00F',
                    width: 1
                })
            })
        };

        var styleFunction = function(feature, resolution){
            //地图变换一次分辨率,就执行一次本样式函数
            var featureStyleFunction = feature.getStyleFunction();   //获取要素的样式函数
            if(featureStyleFunction){
                //如果要素拥有样式函数
                return featureStyleFunction.call(feature, resolution);
            }else{
                return defaultStyle[feature.getGeometry().getType()];
            }
        }
上面的代码,首先初始化了一个存储多种矢量图形样式的默认样式对象defaultStyle,然后构建了一个样式函数styleFunction。
styleFunction通过判断矢量图形的类型返回defaultStyle中对应的样式。
需要注意的是:地图的缩放级别的变换一次(分辨率变换与缩放级别变换对应),styleFunction函数就会执行一次。
2.4、显示新添加的要素的信息
接下来需要构建显示新添加的要素的信息的功能:当鼠标光标放在新添加的要素上面就在地图下面显示该要素的信息。
var displayFeatureInfo = function(pixel){
var features = [];
map.forEachFeatureAtPixel(pixel, function(feature){
//如果鼠标光标所在地图坐标与要素相交,则将相交的要素添加到features数组
features.push(feature);
});
if(features.length > 0){
//如果存在与鼠标坐标相交的要素,则将相交的要素的信息在浏览器页面中显示出来
var info = [];
var i, ii;
for(i = 0, ii = features.length; i < ii; ++i){
info.push(features[i].get('name')); //将要素的'name'属性添加到info数组
}
document.getElementById('info').innerHTML = info.join(', ') || ' ';
}else{
document.getElementById('info').innerHTML = ' ';
}
};
map.on('pointermove', function(evt){ //为地图绑定'pointermove'事件的处理程序
if(evt.dragging){
//由于地图被鼠标拖拽也会触发'pointermove'事件,
//所以这里返回return避免地图被拖拽时多次重复调用displayFeatureInfo
//这样做提高了效率
return;
}
var pixel = map.getEventPixel(evt.originalEvent);
displayFeatureInfo(pixel);
});
map.on('click', function(evt){ //为地图绑定'click'事件的事件处理程序
displayFeatureInfo(evt.pixel);
})
三、完整代码与测试
<!DOCTYPE html>
<html lang="en">
<head>
<meta charset="UTF-8">
<meta name="viewport" content="width=device-width, initial-scale=1.0">
<meta http-equiv="X-UA-Compatible" content="ie=edge">
<title>Drag-and-Drop Image Vector</title>
<link href="ol_v5.0.0/css/ol.css" rel="stylesheet" type="text/css" />
<script src="ol_v5.0.0/build/ol.js" type="text/javascript"></script>
</head>
<body>
<div id="map" class="map"></div>
<div id="info"> </div>
<script>
var defaultStyle = {
//点样式
'Point': new ol.style.Style({
image: new ol.style.Circle({
fill: new ol.style.Fill({
color: 'rgba(255, 255, 0, 0.5)'
}),
radius: 5,
stroke: new ol.style.Stroke({
color: '#FF0',
width: 1
})
})
}),
//线样式
'LineString': new ol.style.Style({
stroke: new ol.style.Stroke({
color: '#F00',
width: 3
})
}),
//多变形样式
'Polygon': new ol.style.Style({
fill: new ol.style.Fill({
color: 'rgba(0, 255, 255, 0.5)'
}),
stroke: new ol.style.Stroke({
color: '#0FF',
width: 1
})
}),
//多点样式
"MultiPoint": new ol.style.Style({
image: new ol.style.Circle({
fill: new ol.style.Fill({
color: 'rgba(255, 0, 255, 0.5)'
}),
radius: 5,
stroke: new ol.style.Stroke({
color: '#F0F',
width: 1
})
})
}),
//多线样式
'MultiLineString': new ol.style.Style({
stroke: new ol.style.Stroke({
color: "#0f0",
width: 3
})
}),
//多多边形样式
'MultiPolygon': new ol.style.Style({
fill: new ol.style.Fill({
color: 'rgba(0, 0, 255, 0.5)'
}),
stroke: new ol.style.Stroke({
color: '#00F',
width: 1
})
})
};
var styleFunction = function(feature, resolution){
//地图变换一次分辨率,就执行一次本样式函数
var featureStyleFunction = feature.getStyleFunction(); //获取要素的样式函数
if(featureStyleFunction){
//如果要素拥有样式函数
return featureStyleFunction.call(feature, resolution);
}else{
console.log(2);
return defaultStyle[feature.getGeometry().getType()];
}
}
var dragAndDropInteraction = new ol.interaction.DragAndDrop({
formatConstructors: [ //支持加载的地理数据的格式
ol.format.GPX,
ol.format.GeoJSON,
ol.format.IGC,
ol.format.KML,
ol.format.TopoJSON
]
});
var map = new ol.Map({
//添加控件到地图
interactions: ol.interaction.defaults().extend([dragAndDropInteraction]),
layers: [
new ol.layer.Tile({
source: new ol.source.OSM()
})
],
target: 'map',
view: new ol.View({
center: [0, 0],
zoom: 2
})
});
dragAndDropInteraction.on('addfeatures', function(event){ //当文件数据拖拉到浏览器时触发该事件
var vectorSource = new ol.source.Vector({ //设置数据源
features: event.features
});
map.addLayer(new ol.layer.Vector({ //初始化矢量图层并添加到地图
renderMode: 'image', //矢量图层渲染为图片
source: vectorSource,
style: styleFunction //矢量图层的样式
}));
map.getView().fit(vectorSource.getExtent()); //视图缩放至新添加的矢量要素
});
var displayFeatureInfo = function(pixel){
var features = [];
map.forEachFeatureAtPixel(pixel, function(feature){
//如果鼠标光标所在地图坐标与要素相交,则将相交的要素添加到features数组
features.push(feature);
});
if(features.length > 0){
//如果存在与鼠标坐标相交的要素,则将相交的要素的信息在浏览器页面中显示出来
var info = [];
var i, ii;
for(i = 0, ii = features.length; i < ii; ++i){
info.push(features[i].get('name')); //将要素的'name'属性添加到info数组
}
document.getElementById('info').innerHTML = info.join(', ') || ' ';
}else{
document.getElementById('info').innerHTML = ' ';
}
};
map.on('pointermove', function(evt){ //为地图绑定'pointermove'事件的处理程序
if(evt.dragging){
//由于地图被鼠标拖拽也会触发'pointermove'事件,
//所以这里返回return避免地图被拖拽时多次重复调用displayFeatureInfo
//这样做提高了效率
return;
}
var pixel = map.getEventPixel(evt.originalEvent);
displayFeatureInfo(pixel);
});
map.on('click', function(evt){ //为地图绑定'click'事件的事件处理程序
displayFeatureInfo(evt.pixel);
})
</script>
</body>
</html>
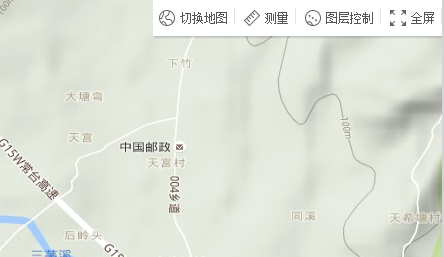
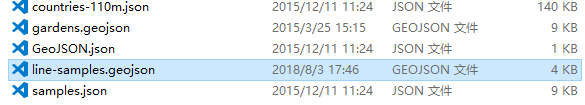
随便拖拉一个geojson文件到浏览器中:

如图所示,文件数据已经被成功加载到地图中,鼠标光标放在要素上面,页面也能显示相应的要素信息。
四、总结
实现这个功能,其实就是简单的添加了一个DragAndDrop控件,得到的效果却很不错!
转载自:https://blog.csdn.net/qq_35732147/article/details/82857029