OL3实现图例的创建
前言:无需多说,是非常重要的,OL中并没有实现图例的控件,arcgis api中倒是有图例的模板,其实制作图例并不是很困难,我们只要做些函数封装,和做一些简单css设置就行,今天领导给我说已经很久没有更新博客了,所以今天要写一篇,最近发现一个问题,别人给我评论的问题,让CSDN给吃了,我也是无语。
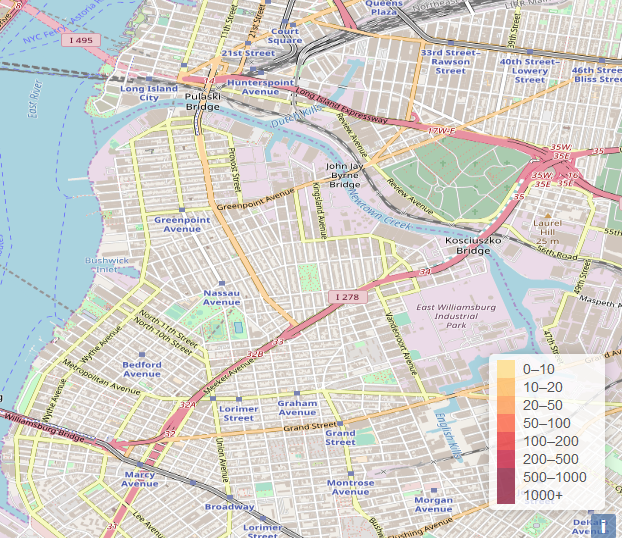
来张图:
一、CSS样式设置
        .info {
            width: 100px;
            padding: 6px 8px;
            font: 14px/16px Arial, Helvetica, sans-serif;
            background: white;
            background: rgba(255, 255, 255, 0.8);
            box-shadow: 0 0 15px rgba(0, 0, 0, 0.2);
            border-radius: 5px;
            z-index: 99999;
            position: absolute;
            right: 30px;
            bottom: 20px;
        }

            .info h4 {
                margin: 0 0 5px;
                color: #777;
            }

        .legend {
            text-align: left;
            line-height: 18px;
            color: #555;
        }

            .legend i {
                width: 18px;
                height: 18px;
                float: left;
                margin-right: 8px;
                opacity: 0.7;
            }
设置图例的位置,在css中设置位置
二、图例函数封装
function createLegend(inputGrades,inputColors ) {
var div = $("<div>");
div.attr("class", "info legend");
var defaultGrades = [0, 10, 20, 50, 100, 200, 500, 1000],
defaultColors = ['#FFEDA0', '#FED976', '#FEB24C', '#FD8D3C', '#FC4E2A', '#E31A1C', '#BD0026', '#800026'],
grades = inputGrades.length > 0 ? inputGrades : defaultGrades,
colors = inputColors.length > 0 ? inputColors : defaultColors,
labels = [],
from, to;
for (var i = 0; i < grades.length; i++) {
from = grades[i];
to = grades[i + 1];
labels.push(
'<i style="background:' + getColor(from + 1) + '"></i> ' +
from + (to ? '–' + to : '+'));
console.log(labels[i]);
}
div.append(labels.join('<br>'));
$("body").append(div);
// 根据属性范围设置渲染颜色
function getColor(d) {
return d > grades[6] ? colors[7] :
d > grades[5] ? colors[6] :
d > grades[4] ? colors[5] :
d > grades[3] ? colors[4] :
d > grades[2] ? colors[3] :
d > grades[1] ? colors[2] :
d > grades[0] ? colors[1] :
colors[0];
}
}
createLegend(0,0);
三、总结
该图例是参考leaflet做出来的,不过在leaflet中我是直接把他做成了控件,在OL中仅仅做了一些函数的封装。
转载自:https://blog.csdn.net/weixin_40184249/article/details/82889652