Status Monitoring
The status monitoring module add some extra information about the system in the GeoServer status page in a new tab named Monitoring
and make that info queryable through GeoServer REST interface. This info should allow an administrator to get a quick understanding about the status of the GeoServer instance.
Library OSHI is used to retrieving system-level information without depending on native libraries or DLLs, relying solely on Apache JNA. Major operating systems (Linux, Windows and MacOX) are supported out of the box.
The available system information is:
| Info | Example | Description |
| Operating system | Linux Mint 18 | Name of the operating system and the used version |
| Uptime | 08:34:50 | Up time of the system |
| System average load 1 minute | 0.90 | System average load for the last minute |
| System average load 5 minutes | 1.12 | System average load for the last five minute |
| System average load 15 minute | 0.68 | System average load for the last fifteen minute |
| Number of physical CPUs | 4 | Number of physical CPUs / cores available |
| Number of logical CPUs | 8 | Number of logical CPUs / cores available |
| Number of running process | 316 | Total number of process running in the system |
| Number of running threads | 1094 | Total number of threads running in the system |
| CPU load average | 4.12 % | Average load of the CPU in the last second |
| CPU * load | 11.43 % | Load of a specific core in the last second |
| Used physical memory | 31.58 % | Percentage of the system memory used |
| Total physical memory | 31.4 GiB | System total memory |
| Free physical memory | 21.4 GiB | System memory available for use |
| Used swap memory | 0.00% | Percentage of swap memory used |
| Total swap memory | 32.0 GiB | System total swap memory |
| Free swap memory | 32.0 GiB | Free swap memory |
| File system usage | 65.47 % | File system usage taking in account all partitions |
| Partition * used space | 54.8 % | Percentage of space used in a specific partition |
| Partition * total space | 338.9 GiB | Total space of a specific partition |
| Partition * free space | 117.0 GiB | Free space on a specific partition |
| Network interfaces send | 42.0 MiB | Data send through all the available network interfaces |
| Network interfaces received | 700.4 MiB | Data received through all the available network interfaces |
| Network interface * send | 25.0 MiB | Data send through a specific network interface |
| Network interface * received | 250.4 MiB | Data received through a specific network interface |
| CPU temperature | 52.00 ºC | CPU temperature |
| CPU voltage | 1.5 V | CPU voltage |
| GeoServer CPU usage | 3.5 % | Percentage of CPU used by GeoServer in the last second |
| GeoServer threads | 49 | Number of threads created by GeoServer |
| GeoServer JVM memory usage | 5.83 % | Percentage of the JVM memory used by GeoServer |
If some information is not available the special term NOT AVAILABLE will appear. Values will be automatically converted to best human readable unit.
Installing the extension
- Download the Status Monitoring extension from the nightly GeoServer community module builds.
- Place the JARs into the
WEB-INF/libdirectory of the GeoServer installation.
Usage
The system information will be available in the GeoServer status page in the Monitoring tab (the following image only shows part of the available system information):
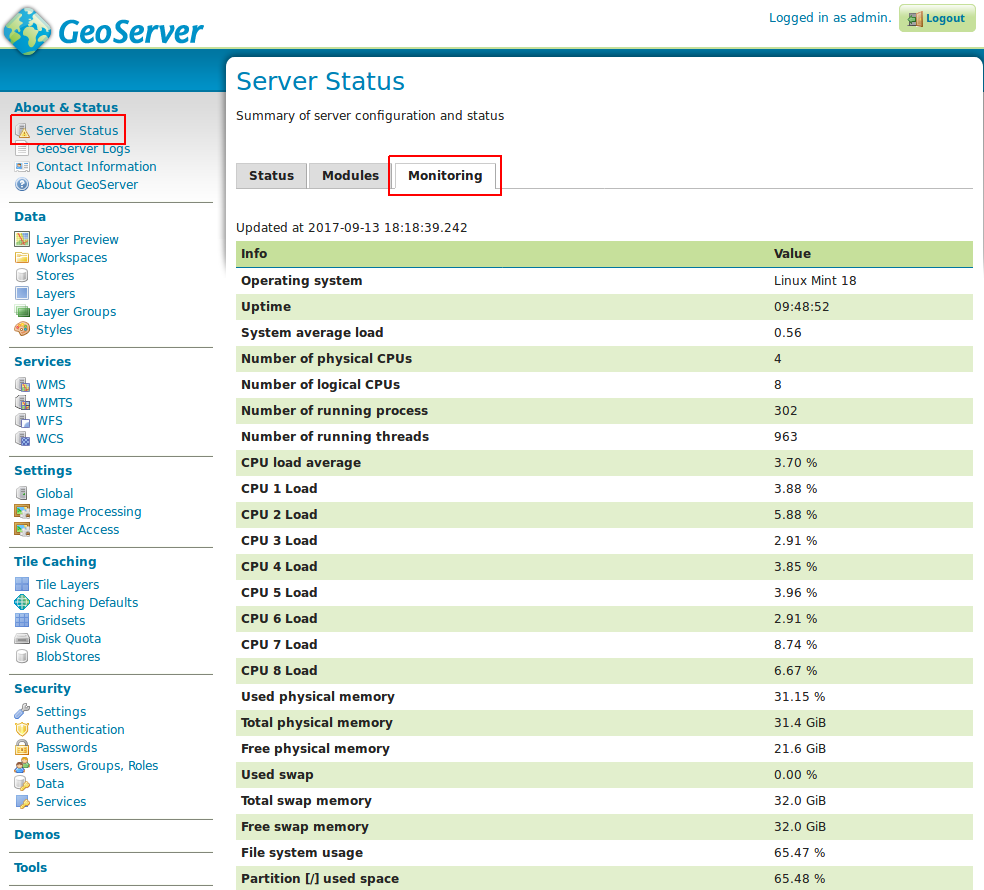
If the Monitoring tab is not present, it means that the plugin was not installed correctly. The Monitoring tab content will be refreshed automatically every second.
REST interface
It is possible to request the available system information (monitoring data) through GeoServer REST API. The supported formats are XML, JSON and HTML.
The available REST endpoints are:
/geoserver/rest/about/monitoring

/geoserver/rest/about/monitoring.json

/geoserver/rest/about/monitoring.xml

/geoserver/rest/about/monitoring.html
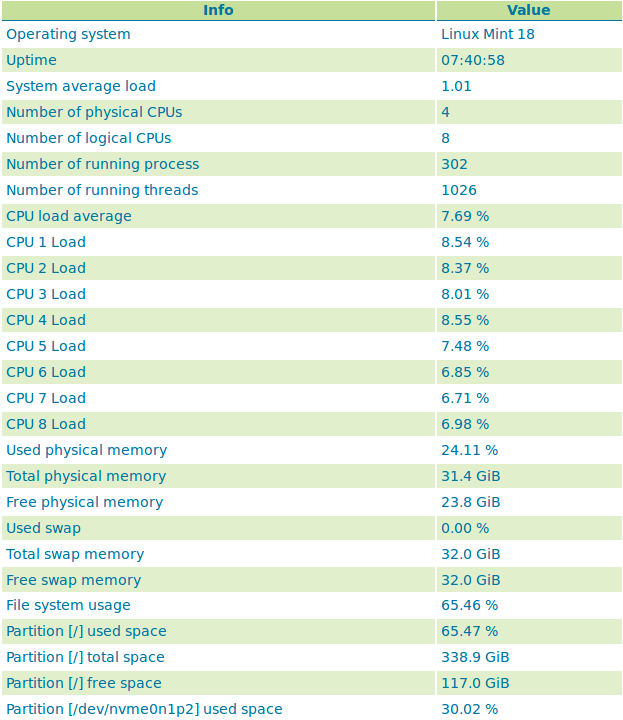
The HTML representation of the system data is equal to the Monitoring tab representation:
The XML and JSON representations are quite similar, for each system information the following attributes will be available:
| Name | Description |
| name | name of the metric |
| available | TRUE if the system information value is available |
| description | description of this system information |
| unit | unit of the system information, can be empty |
| category | category of this system information |
| priority | this value can be used to render the metrics in a predefined order |
| identifier | identifies the resource associated with the metric, e.g. file partition name |
Example of XML representation:
    <metrics>
<metric>
  <value>99614720</value>
  <available>true</available>
  <description>Partition [/dev/nvme0n1p2] total space</description>
  <name>PARTITION_TOTAL</name>
  <unit>bytes</unit>
  <category>FILE_SYSTEM</category>
  <identifier>/dev/nvme0n1p2</identifier>
  <priority>507</priority>
</metric>
            (...)
Example of JSON representation:
{
    "metrics": {
        "metric": [
            {
          "available": true,
          "category": "FILE_SYSTEM",
          "description": "Partition [/dev/nvme0n1p2] total space",
          "identifier": "/dev/nvme0n1p2",
          "name": "PARTITION_TOTAL",
          "priority": 507,
          "unit": "bytes",
          "value": 99614720
      },
            (...)