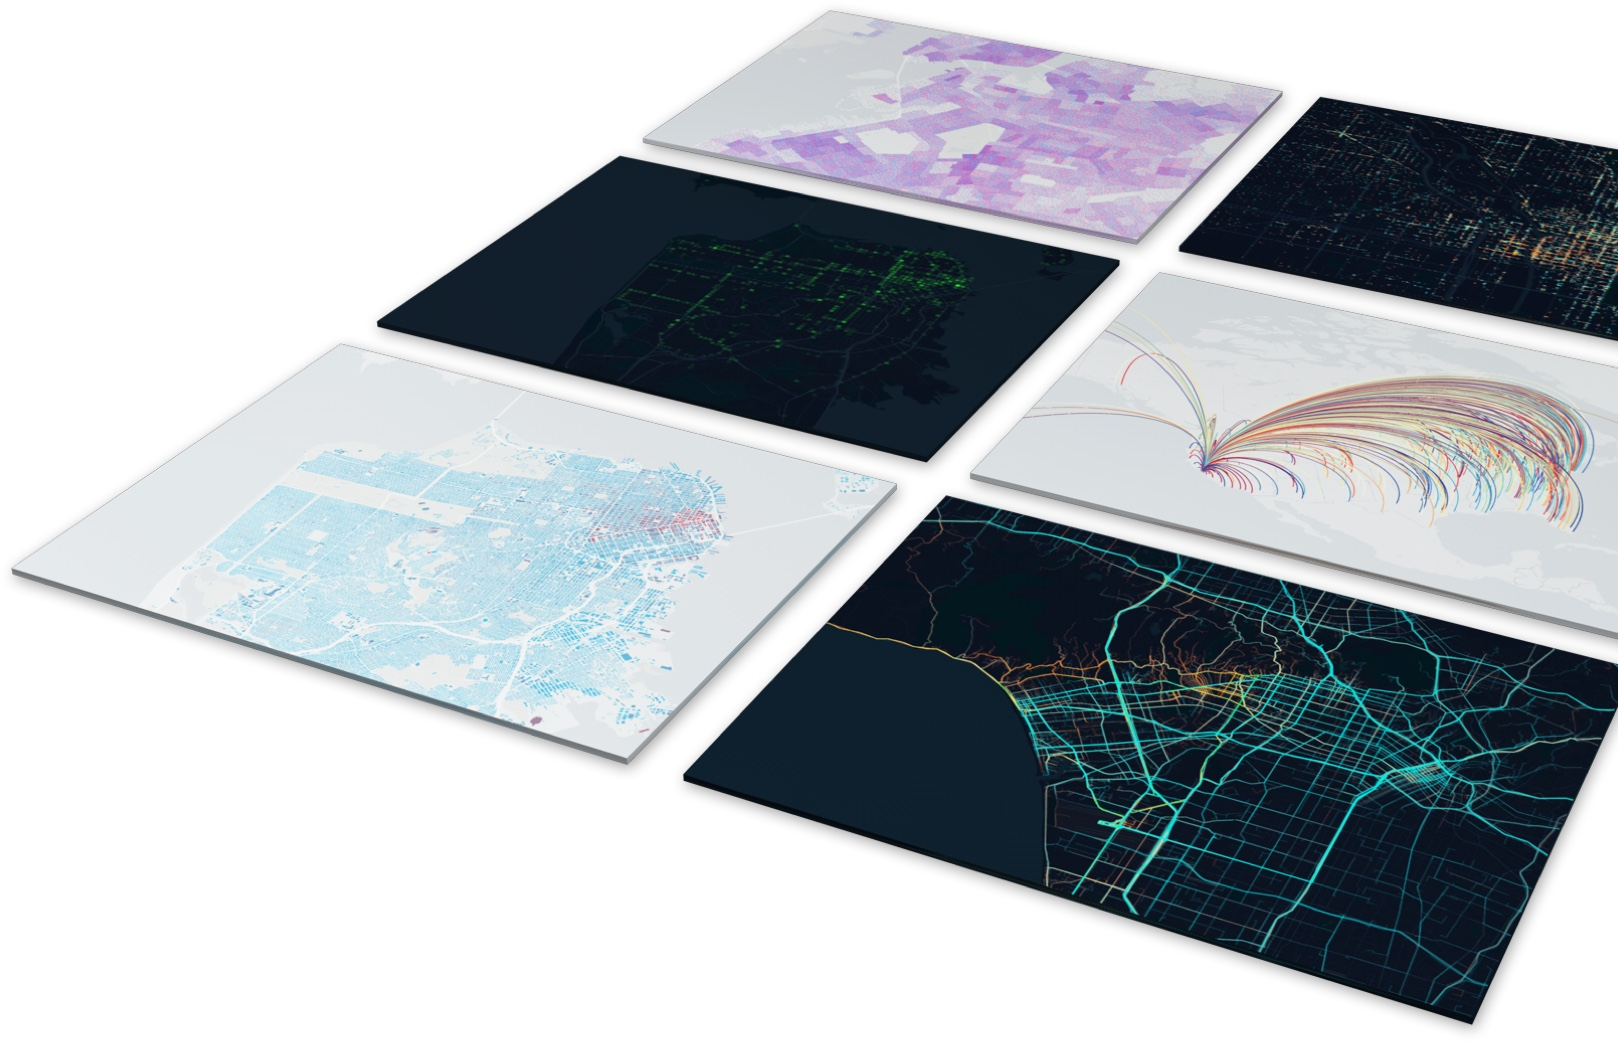
deck.gl渲染GeoJsonLayer面图层
目录

在线地址
功能说明
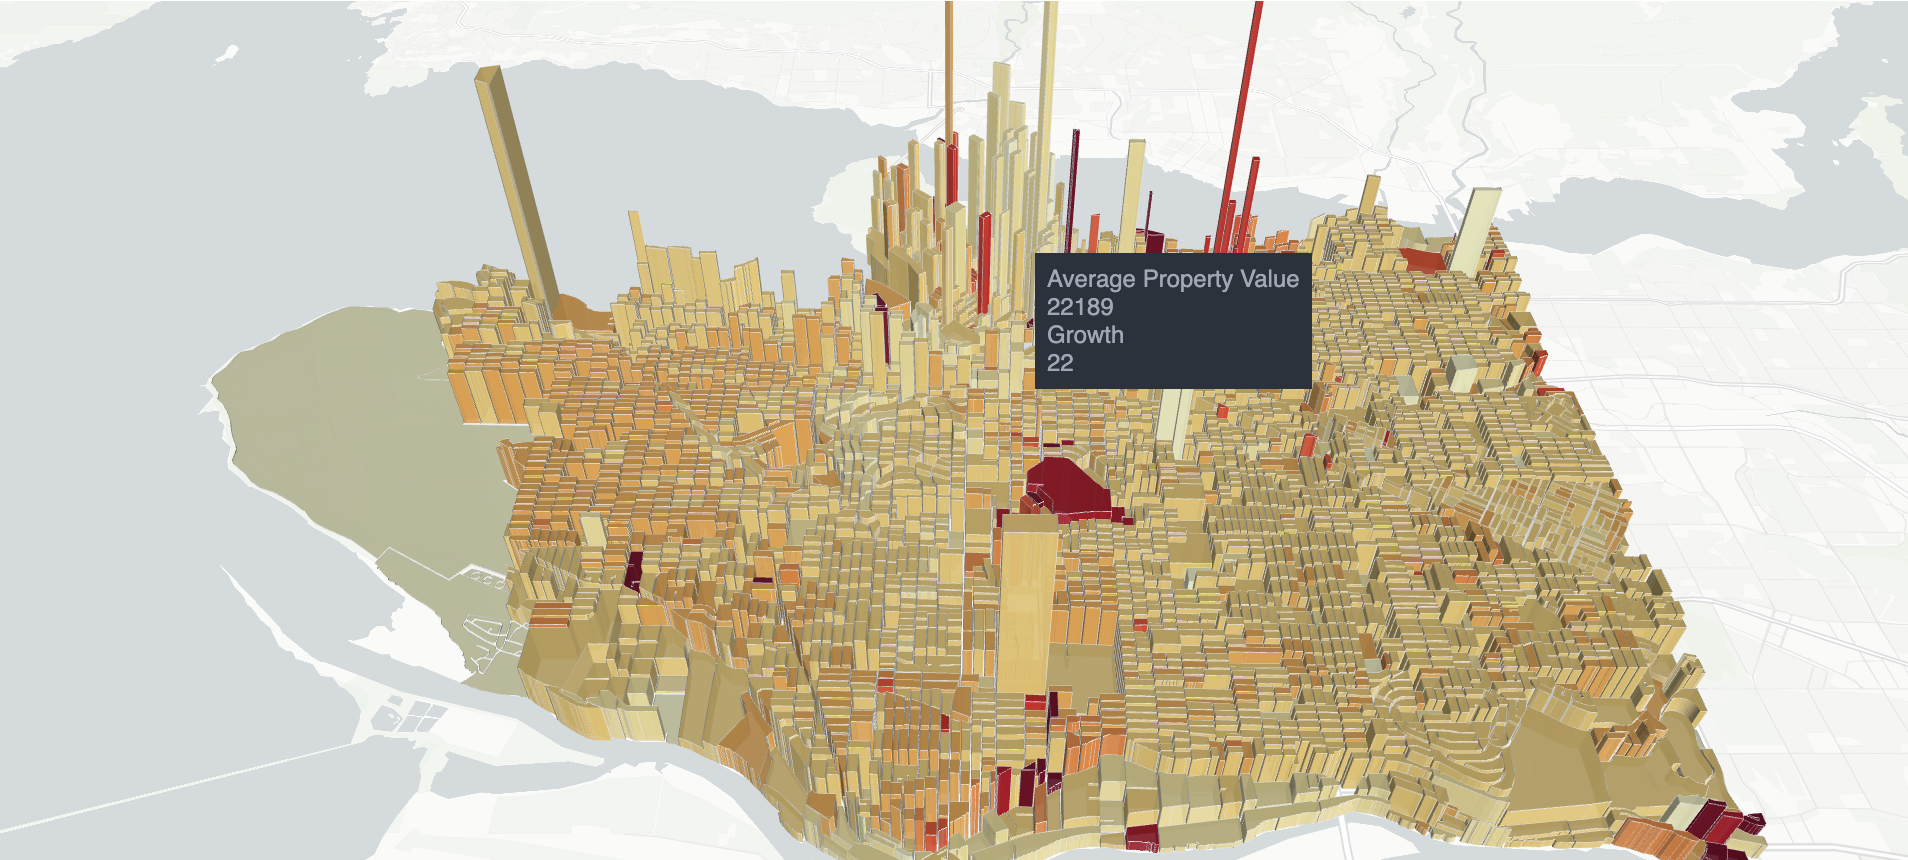
本实例实现了deck.gl加载底图,通过GeoJsonLayer渲染geojson数据,并实现点击捕捉要素,展示属性。
代码解析
- 此部分是引入在线deck.gl包,因为要用到mapboxgl的底图数据,同时引入了mapboxgl包;还设置了基本的css样式
 <head>
    <title>deck.gl GeoJsonLayer (Polygon) Example</title>

    <script src="https://unpkg.com/deck.gl@^8.8.0/dist.min.js"></script>
    <script src="https://api.tiles.mapbox.com/mapbox-gl-js/v1.13.0/mapbox-gl.js"></script>

    <style type="text/css">
      body {
        width: 100vw;
        height: 100vh;
        margin: 0;
        overflow: hidden;
      }
      .deck-tooltip {
        font-family: Helvetica, Arial, sans-serif;
        padding: 6px !important;
        margin: 8px;
        max-width: 300px;
        font-size: 10px;
      }
    </style>
</head>- 这部分是es6写法,引入需要的模块DeckGL、GeoJsonLayer,并定义颜色常量
  const {DeckGL, GeoJsonLayer} = deck;

    const COLOR_SCALE = [
      // negative
      [65, 182, 196],
      [127, 205, 187],
      [199, 233, 180],
      [237, 248, 177],

      // positive
      [255, 255, 204],
      [255, 237, 160],
      [254, 217, 118],
      [254, 178, 76],
      [253, 141, 60],
      [252, 78, 42],
      [227, 26, 28],
      [189, 0, 38],
      [128, 0, 38]
    ];
- 初始化GeoJsonLayer图层
const geojsonLayer = new GeoJsonLayer({
      data: 'https://raw.githubusercontent.com/visgl/deck.gl-data/master/examples/geojson/vancouver-blocks.json',// 指定数据源
      opacity: 0.8,//透明度
      stroked: false,//是否设置边线颜色
      filled: true,//面是否填充
      extruded: true,//是否按z值拉高
      wireframe: true,//是否生成六边形的线框。 轮廓将具有关闭顶部和底部多边形的“水平”线和用于多边形上每个顶点的垂直线(“支柱”)。

      getElevation: f => Math.sqrt(f.properties.valuePerSqm) * 10,//面要素的高程
      getFillColor: f => colorScale(f.properties.growth),
      getLineColor: [255, 255, 255],//填充色

      pickable: true //是否可以捕捉
    });
    // 随机设置填充色
    function colorScale(x) {
      const i = Math.round(x * 7) + 4;
      if (x < 0) {
        return COLOR_SCALE[i] || COLOR_SCALE[0];
      }
      return COLOR_SCALE[i] || COLOR_SCALE[COLOR_SCALE.length - 1];
}- 根据捕捉到的对象格式化属性框内容
// 根据捕捉到的对象格式化属性框内容
function getTooltip({object}) {
      return object && `Average Property Value
        ${object.properties.valuePerSqm}
        Growth
        ${Math.round(object.properties.growth * 100)}`;
    }
5.初始化DeckGL渲染
 new DeckGL({
      mapStyle: 'https://basemaps.cartocdn.com/gl/positron-nolabels-gl-style/style.json',//底图样式
      initialViewState: {// 地图视图初始状态
        latitude: 49.254,// 纬度
        longitude: -123.13,// 经度
        zoom: 11,//缩放级别
        maxZoom: 16,//最大缩放级别
        pitch: 45//俯仰
      },
      controller: true,
      layers: [geojsonLayer],//图层
      getTooltip //点击属性弹窗
    });
源代码
拷贝到html文件中可直接用浏览器打开
<html>
  <head>
    <title>deck.gl GeoJsonLayer (Polygon) Example</title>

    <script src="https://unpkg.com/deck.gl@^8.8.0/dist.min.js"></script>
    <script src="https://api.tiles.mapbox.com/mapbox-gl-js/v1.13.0/mapbox-gl.js"></script>

    <style type="text/css">
      body {
        width: 100vw;
        height: 100vh;
        margin: 0;
        overflow: hidden;
      }
      .deck-tooltip {
        font-family: Helvetica, Arial, sans-serif;
        padding: 6px !important;
        margin: 8px;
        max-width: 300px;
        font-size: 10px;
      }
    </style>
  </head>

  <body>
  </body>

  <script type="text/javascript">

    const {DeckGL, GeoJsonLayer} = deck;

    const COLOR_SCALE = [
      // negative
      [65, 182, 196],
      [127, 205, 187],
      [199, 233, 180],
      [237, 248, 177],

      // positive
      [255, 255, 204],
      [255, 237, 160],
      [254, 217, 118],
      [254, 178, 76],
      [253, 141, 60],
      [252, 78, 42],
      [227, 26, 28],
      [189, 0, 38],
      [128, 0, 38]
    ];

    const geojsonLayer = new GeoJsonLayer({
      data: 'https://raw.githubusercontent.com/visgl/deck.gl-data/master/examples/geojson/vancouver-blocks.json',
      opacity: 0.8,
      stroked: false,
      filled: true,
      extruded: true,
      wireframe: true,

      getElevation: f => Math.sqrt(f.properties.valuePerSqm) * 10,
      getFillColor: f => colorScale(f.properties.growth),
      getLineColor: [255, 255, 255],

      pickable: true
    });

    new DeckGL({
      mapStyle: 'https://basemaps.cartocdn.com/gl/positron-nolabels-gl-style/style.json',
      initialViewState: {
        latitude: 49.254,
        longitude: -123.13,
        zoom: 11,
        maxZoom: 16,
        pitch: 45
      },
      controller: true,
      layers: [geojsonLayer],
      getTooltip
    });

    function colorScale(x) {
      const i = Math.round(x * 7) + 4;
      if (x < 0) {
        return COLOR_SCALE[i] || COLOR_SCALE[0];
      }
      return COLOR_SCALE[i] || COLOR_SCALE[COLOR_SCALE.length - 1];
    }

    function getTooltip({object}) {
      return object && `Average Property Value
        ${object.properties.valuePerSqm}
        Growth
        ${Math.round(object.properties.growth * 100)}`;
    }

  </script>
</html>