deck.gl渲染BitmapLayer位图图层
目录
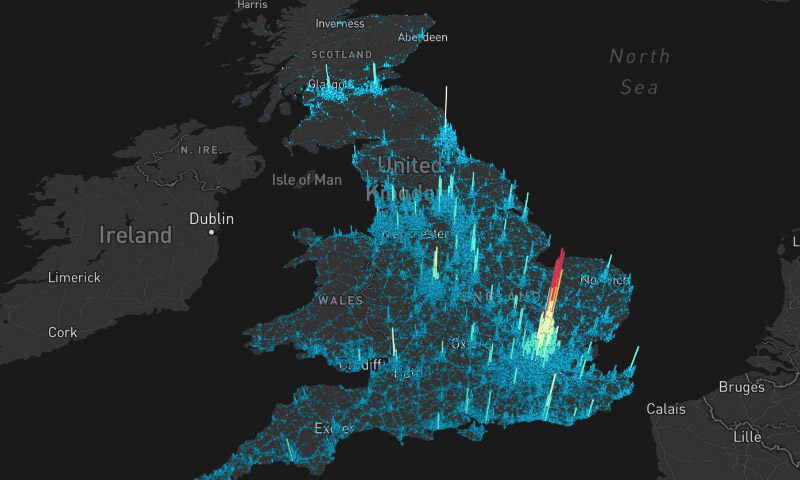
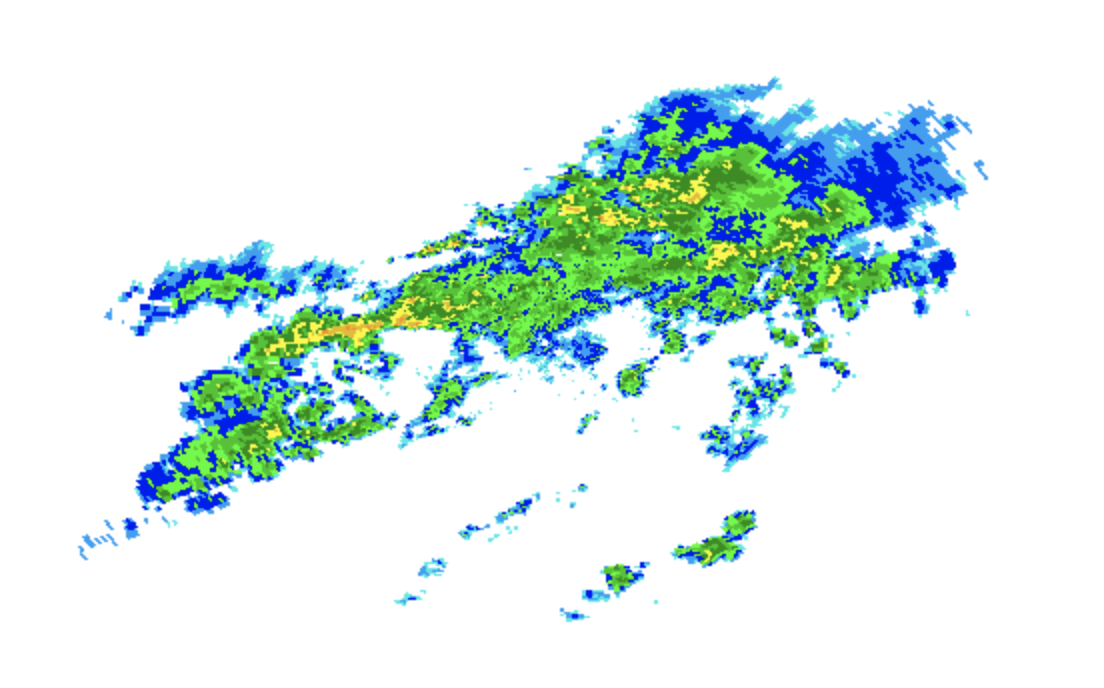
效果图

在线地址
deck.gl渲染BitmapLayer位图图层
https://tool.giserdqy.com/deckgl/bitmap-layer.html
功能说明
本实例实现了deck.gl加载底图,使用BitmapLayer加载位图数据,渲染到图上。
数据格式
位图数据指的是图片,附带四个角的坐标(四至),可以把图片根据坐标放到指定位置渲染。

代码解析
- 此部分是引入在线deck.gl包,因为要用到mapboxgl的底图数据,同时引入了mapboxgl包;设置了基本的css样式
 <html>
  <head>
    <title>deck.gl BitmapLayer Example</title>

    <script src="https://unpkg.com/deck.gl@^8.8.0/dist.min.js"></script>
    <script src="https://api.tiles.mapbox.com/mapbox-gl-js/v1.13.0/mapbox-gl.js"></script>

    <style type="text/css">
      body {
        width: 100vw;
        height: 100vh;
        margin: 0;
      }
    </style>
</head>- 这部分是es6写法,引入需要的模块DeckGL、BitmapLayer,并初始化DeckGL(GeoJsonLayer已经有过解释可参照deck.gl渲染GeoJsonLayer
https://www.giserdqy.com/secdev/deckgl/39849/
初始化BitmapLayer图层,详细配置说明见注释
  <script type="text/javascript">
    const {DeckGL, BitmapLayer} = deck;

    // MapBox example : https://docs.mapbox.com/mapbox-gl-js/example/image-on-a-map/
    new DeckGL({
      mapStyle: 'https://basemaps.cartocdn.com/gl/dark-matter-nolabels-gl-style/style.json',
      initialViewState: {
        longitude: -75.789,
        latitude: 41.874,
        zoom: 5,
        maxZoom: 9
      },
      controller: true,
      layers: [
        new BitmapLayer({
          id: 'bitmap-layer', // 图层唯一id
          bounds: [ // 位图四至
            [-80.425, 37.936],//左下
            [-80.425, 46.437],//左上
            [-71.516, 46.437],//右上
            [-71.516, 37.936]//右下
          ],
          image: 'https://docs.mapbox.com/mapbox-gl-js/assets/radar.gif' //位图地址
        })
      ]
    });

  </script>
源代码
拷贝到html文件中可直接用浏览器打开
<html>
  <head>
    <title>deck.gl BitmapLayer Example</title>

    <script src="https://unpkg.com/deck.gl@^8.8.0/dist.min.js"></script>
    <script src="https://api.tiles.mapbox.com/mapbox-gl-js/v1.13.0/mapbox-gl.js"></script>

    <style type="text/css">
      body {
        width: 100vw;
        height: 100vh;
        margin: 0;
      }
    </style>
  </head>

  <body></body>

  <script type="text/javascript">
    const {DeckGL, BitmapLayer} = deck;

    // MapBox example : https://docs.mapbox.com/mapbox-gl-js/example/image-on-a-map/
    new DeckGL({
      mapStyle: 'https://basemaps.cartocdn.com/gl/dark-matter-nolabels-gl-style/style.json',
      initialViewState: {
        longitude: -75.789,
        latitude: 41.874,
        zoom: 5,
        maxZoom: 9
      },
      controller: true,
      layers: [
        new BitmapLayer({
          id: 'bitmap-layer',
          bounds: [
            [-80.425, 37.936],
            [-80.425, 46.437],
            [-71.516, 46.437],
            [-71.516, 37.936]
          ],
          image: 'https://docs.mapbox.com/mapbox-gl-js/assets/radar.gif'
        })
      ]
    });

  </script>
</html>