
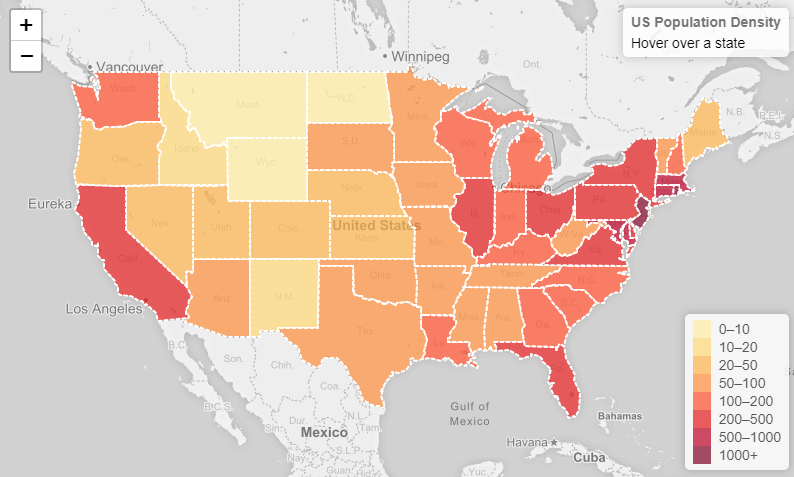
leaflet之唯一值渲染专题图
目录
leaflet之唯一值渲染专题图

数据格式
本例通过us-states.js引入的数据,可以通过http请求回json数据
代码解释
<!DOCTYPE html>
<html>
<head>
<title>Choropleth Tutorial - Leaflet</title>
<meta charset="utf-8" />
<meta name="viewport" content="width=device-width, initial-scale=1.0">
<link rel="shortcut icon" type="image/x-icon" href="docs/images/favicon.ico" />
<link rel="stylesheet" href="https://unpkg.com/leaflet@1.3.4/dist/leaflet.css" integrity="sha512-puBpdR0798OZvTTbP4A8Ix/l+A4dHDD0DGqYW6RQ+9jxkRFclaxxQb/SJAWZfWAkuyeQUytO7+7N4QKrDh+drA==" crossorigin="" />
<script src="https://unpkg.com/leaflet@1.3.4/dist/leaflet.js" integrity="sha512-nMMmRyTVoLYqjP9hrbed9S+FzjZHW5gY1TWCHA5ckwXZBadntCNs8kEqAWdrb9O7rxbCaA4lKTIWjDXZxflOcA==" crossorigin=""></script>
<style>
html,
body {
height: 100%;
margin: 0;
}
#map {
width: 600px;
height: 400px;
}
</style>
<style>
#map {
width: 800px;
height: 500px;
}
.info {
padding: 6px 8px;
font: 14px/16px Arial, Helvetica, sans-serif;
background: white;
background: rgba(255, 255, 255, 0.8);
box-shadow: 0 0 15px rgba(0, 0, 0, 0.2);
border-radius: 5px;
}
.info h4 {
margin: 0 0 5px;
color: #777;
}
.legend {
text-align: left;
line-height: 18px;
color: #555;
}
.legend i {
width: 18px;
height: 18px;
float: left;
margin-right: 8px;
opacity: 0.7;
}
</style>
</head>
<body>
<div id='map'></div>
<script type="text/javascript" src="us-states.js"></script>//引入数据
<script type="text/javascript">
var map = L.map('map').setView([37.8, -96], 4);
//初始化地图,添加底图
L.tileLayer('https://api.tiles.mapbox.com/v4/{id}/{z}/{x}/{y}.png?access_token=pk.eyJ1IjoibWFwYm94IiwiYSI6ImNpejY4NXVycTA2emYycXBndHRqcmZ3N3gifQ.rJcFIG214AriISLbB6B5aw', {
maxZoom: 18,
attribution: 'Map data © <a href="https://www.openstreetmap.org/">OpenStreetMap</a> contributors, ' +
'<a href="https://creativecommons.org/licenses/by-sa/2.0/">CC-BY-SA</a>, ' +
'Imagery © <a href="https://www.mapbox.com/">Mapbox</a>',
id: 'mapbox.light'
}).addTo(map);
// 自定义显示信息的control,也可以设置popup弹出框
var info = L.control();
info.onAdd = function(map) {//设置显示样式
this._div = L.DomUtil.create('div', 'info');
this.update();
return this._div;
};
info.update = function(props) {//显示内容
this._div.innerHTML = '<h4>US Population Density</h4>' + (props ?
'<b>' + props.name + '</b><br />' + props.density + ' people / mi<sup>2</sup>' :
'Hover over a state');
};
//添加到地图
info.addTo(map);
//初始化图层,设置style,onEachFeature要素绑定
var geojson = L.geoJson(statesData, {//geojson数据,本例通过js引入的,可以通过http请求或者自定义
style: style,
onEachFeature: onEachFeature
}).addTo(map);
//创建图例
var legend = L.control({ position: 'bottomright' });
legend.onAdd = function(map) {
//创建图例div
var div = L.DomUtil.create('div', 'info legend'),
grades = [0, 10, 20, 50, 100, 200, 500, 1000],
labels = [],
from, to;
for (var i = 0; i < grades.length; i++) {
from = grades[i];
to = grades[i + 1];
labels.push(
'<i style="background:' + getColor(from + 1) + '"></i> ' +
from + (to ? '–' + to : '+'));
}
div.innerHTML = labels.join('<br>');
return div;
};
//添加图例
legend.addTo(map);
// 根据属性范围设置渲染颜色
function getColor(d) {
return d > 1000 ? '#800026' :
d > 500 ? '#BD0026' :
d > 200 ? '#E31A1C' :
d > 100 ? '#FC4E2A' :
d > 50 ? '#FD8D3C' :
d > 20 ? '#FEB24C' :
d > 10 ? '#FED976' :
'#FFEDA0';
}
//图层样式
function style(feature) {
return {
weight: 2,
opacity: 1,
color: 'white',
dashArray: '3',
fillOpacity: 0.7,
fillColor: getColor(feature.properties.density)
};
}
//根据要素属性设置特殊渲染样式
function highlightFeature(e) {
var layer = e.target;
layer.setStyle({
weight: 5,
color: '#666',
dashArray: '',
fillOpacity: 0.7
});
if (!L.Browser.ie && !L.Browser.opera && !L.Browser.edge) {
layer.bringToFront();
}
info.update(layer.feature.properties);
}
//重置要素样式
function resetHighlight(e) {
geojson.resetStyle(e.target);
info.update();
}
//缩放到要素范围
function zoomToFeature(e) {
map.fitBounds(e.target.getBounds());
}
//每个要素绑定事件
function onEachFeature(feature, layer) {
layer.on({
mouseover: highlightFeature,//鼠标移动上去高亮
mouseout: resetHighlight,//鼠标移出还原
click: zoomToFeature//单击要素缩放到要素范围
});
}
</script>
</body>
</html>