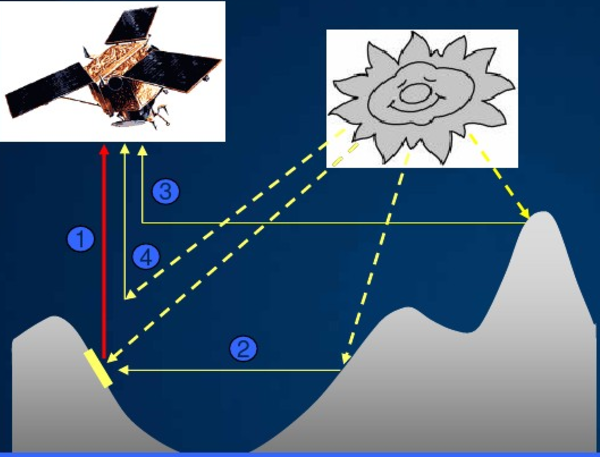
在前端实现地理分析功能——Cesium,ArcPy,Flask实现通视分析(LOS)与缓冲区分析(Buffer)
目录
准备工作:
以本机为例
- 安装Cesium1.4.5,并配置服务(添加地形需要开启Cesium服务)
- 安装ArcMap10.4,对应Arcpy为2.7
- 安装配置ArcServer(计算结果为server服务)
- 安装Flask框架(可以直接在Pycharm里面安装Flask插件)
正文:
1 数据准备
使用工具:arcmap,arcserver,tif转terrain工具;
准备数据:地形数据点云.shp
1.1 地形数据处理
地形数据点云.shp —> 地形.tin —> 地形.tif —> 地形.terrain (具体方法就不细说了)
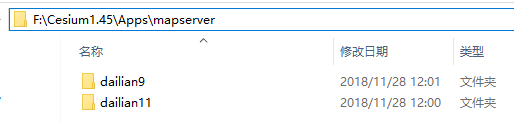
把“地形.terrain”文件夹放到..\Cesium1.45\Apps\mapserver目录下,以备后续使用
1.2 发布LOS服务
P.S.在磁盘跟目录新建文件夹ARCGISDATA,存放所有arcmap用到的文件

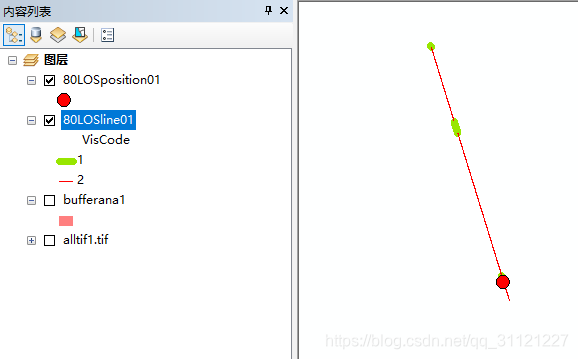
(1)3D分析工具 —> 可见性 —> 通视分析工具 —> 输入“分析路径line.shp”(line不能超出地形.tif范围)
得到通视分析结果(两个.shp文件,一条线,一个点)
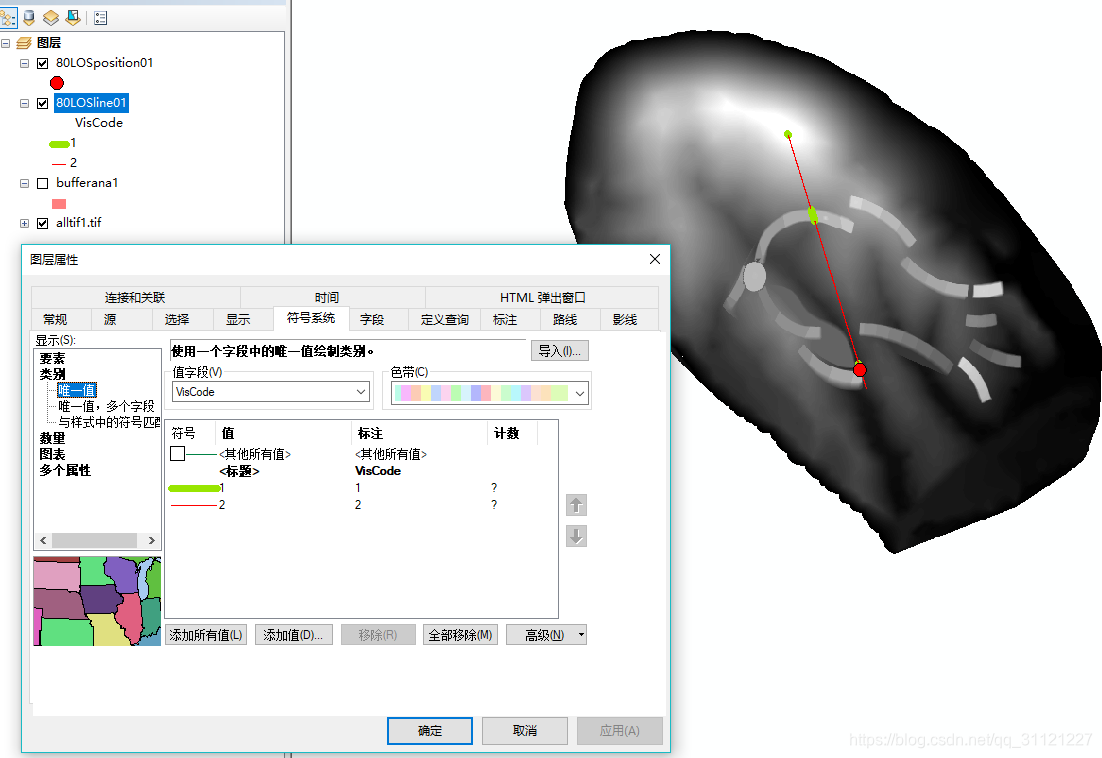
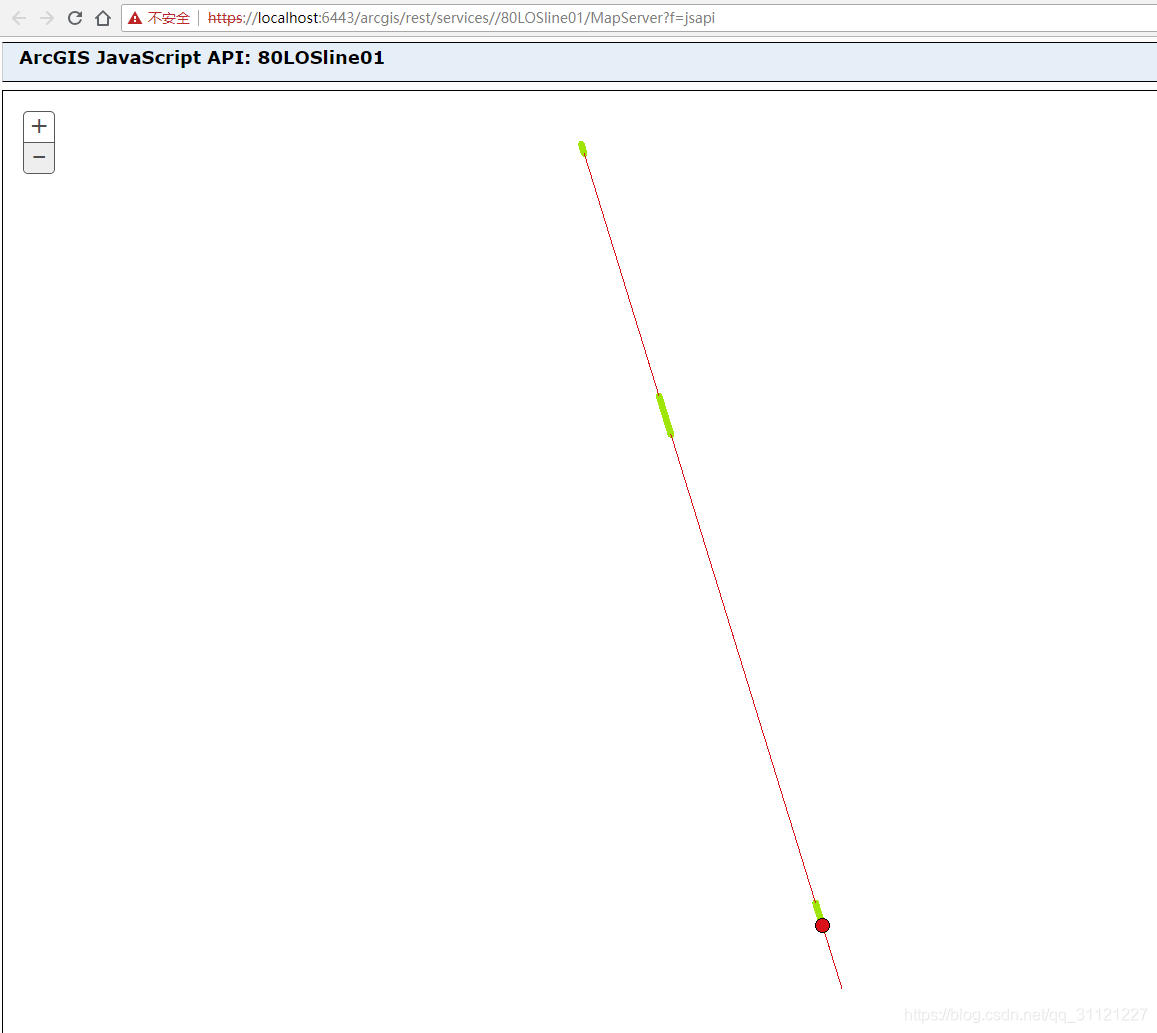
(2)发布
勾选需要发布的要素
发布结果
Buffer同理
2 构建前端页面
使用工具:vscode或pycharm(IDE随意),Cseium,ArcServer
2.1加载地形
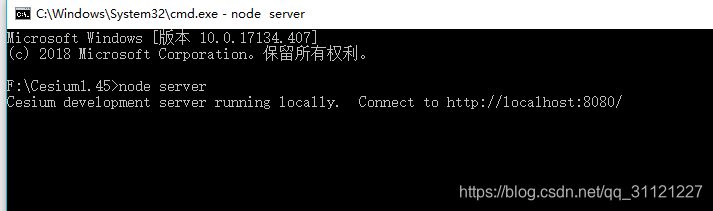
先启动Cesium服务,以后使用是一定要记得开启Cesium服务,不然地图不会加载的。
Cesium使用方法不细说了,这里附上地形加载代码
<script>
   //还记得前面强调的地形文件存放地址吗,现在用到了
   //localhost:8080是Cesium服务默认端口
     var tp = new Cesium.CesiumTerrainProvider({
        url: "http://localhost:8080/Apps/mapserver/dailian11/大连11"
    });

    var viewer = new Cesium.Viewer('cesiumContainer', {
        animation: false,
        baseLayerPicker: true,
        fullscreenButton: false,
        geocoder: false,
        homeButton: true,
        infoBox: true,
        sceneModePicker: true,
        selectionIndicator: true,
        timeline: false,
        navigationHelpButton: false,
        navigationInstructionsInitiallyVisible: false,
     //加载地形
        terrainProvider: tp,
        imageryProvider: new Cesium.ArcGisMapServerImageryProvider({
            url: "http://services.arcgisonline.com/ArcGIS/rest/services/World_Imagery/MapServer"
        })
    });
</script>
查看地形是否加载

2.2加载通视分析,缓冲区分析结果
通视分析和缓冲区分析结果采用异步加载的方式,代码如下
HTML
<div class="shell">
<h5> 分析结果加载 </h5>
 <button type="button" id="buttonLOS03">LOS</button> <br />
 <button type="button" id="buttonBuffer01">Buffer</button> <br />
 <button type="button" id="LOSCLEAR">CLEAR</button><br /> 
<div class="LOSscri">
</div>
<div class="LOSscribuffer">
</div>
</button>
</div>
<div class="shell3">
<div class="btn-group" style="width: 400px">
<hr />
<h4>
<strong> 
<button type="button" class="btn No1point">
第一个点
</button>
</strong>
: (<span id='aa'>经度</span>,<span id='bb'>纬度</span>)
</h4>
<h4>
<strong> 
<button type="button" class="btn No2point">
第二个点
</button>
</strong>
: (<span id='cc'>经度</span>,<span id='dd'>纬度</span>)
 <br />
<span id="result02"> </span>
</h4>
<h4>
 <button type="button" class="btn No3point">
LOS计算
</button>
 <button type="button" class="btn No4point">
缓冲区计算
</button>
</h4>
<hr />
</div>
</div>
CSS
    .shell {
        position: fixed;
        background-color: rgba(216, 207, 207, 1);
        left: 5%;
        top: 10%;
        width: auto;
        height: auto;
        border: #080202 solid 5px;
    }
    .shell3{
        position: fixed;
        background-color:rgba(216, 207, 207, 1);
        right: 5%;
        bottom: 12%;
        width: auto;
        height: auto;
        border: #080202 solid 3px;
     }
JS
计算模块:
//获取鼠标位置
function getPosition() {
//得到当前三维场景
var scene = viewer.scene;
//得到当前三维场景的椭球体
var ellipsoid = scene.globe.ellipsoid;
//设置样式
var entity = viewer.entities.add({
label: {
show: false,
font: '24px Helvetica',
fillColor: Cesium.Color.SKYBLUE,
outlineColor: Cesium.Color.BLACK,
outlineWidth: 2,
style: Cesium.LabelStyle.FILL_AND_OUTLINE,
pixelOffset: new Cesium.Cartesian2(200, -50)
}
});
var longitudeString = null;
var latitudeString = null;
var cartesian = null;
// 定义当前场景的画布元素的事件处理
var handler = new Cesium.ScreenSpaceEventHandler(scene.canvas);
//设置鼠标移动事件的处理函数,这里负责监听x,y坐标值变化
handler.setInputAction(function (movement) {
//通过指定的椭球或者地图对应的坐标系,将鼠标的二维坐标转换为对应椭球体三维坐标
cartesian = viewer.camera.pickEllipsoid(movement.endPosition, ellipsoid);
if (cartesian) {
//将笛卡尔坐标转换为地理坐标
var cartographic = ellipsoid.cartesianToCartographic(cartesian);
// //将弧度转为度的十进制度表示
longitudeString = Cesium.Math.toDegrees(cartographic.longitude).toFixed(6);
latitudeString = Cesium.Math.toDegrees(cartographic.latitude).toFixed(6);
//获取地理坐标和高度
// lonunit_m = cartesian.longitude;
// latunit_m = cartesian.latitude;
height = scene.globe.getHeight(cartographic);
entity.position = cartesian;
entity.label.show = true;
// entity.label.text = cartesia + '(' + cartographic.longitude + ', ' + cartographic.latitude + "," + height + ')';
entity.label.text =
'Cartesian: ' + cartesian + '\u00B0' +
'\nLon: ' + longitudeString +
'\nLat: ' + latitudeString +
'\nHeight: ' + height + '\n' + '\n' + '\n' + '\n';
} else {
entity.label.show = false;
}
}, Cesium.ScreenSpaceEventType.MOUSE_MOVE);
// 坐标输出
$(function () {
$(".No1point").click(function (event) {
$(window).unbind("dblclick");
$(window).dblclick(function (event) {
$("#aa").html(longitudeString);
$("#bb").html(latitudeString);
var lon = $("#aa").html();
var lat = $("#bb").html();
var entity = viewer.entities.add({
name: 'start point',
position: Cesium.Cartesian3.fromDegrees(lon, lat, height),
point: {
color: Cesium.Color.YELLOW,
pixelSize: 30
}
});
});
});
$(".No2point").click(function (event) {
$(window).unbind("dblclick");
$(window).dblclick(function (event) {
$("#cc").html(longitudeString);
$("#dd").html(latitudeString);
var lon = $("#cc").html();
var lat = $("#dd").html();
var entity = viewer.entities.add({
name: 'end point',
position: Cesium.Cartesian3.fromDegrees(lon, lat, height),
point: {
color: Cesium.Color.RED,
pixelSize: 30
}
});
});
});
$(".No3point").click(function (event) {
$(window).unbind("dblclick");
// $(window).dblclick(function (event) {
// console.log("结束");
// });
$("#result02").html("<p> 正在计算LOS,请等待...</p>");
$.ajax({
// url: 'http://localhost:5000/oneLinetoLOS',
url: '/oneLinetoLOS02',
// url: '/LinestoLOS',
data: {
a2: $('#aa').html(),
b2: $('#bb').html(),
c2: $('#cc').html(),
d2: $('#dd').html()
},
dataType: 'JSON',
type: 'GET',
success: function () {
$("#result02").html("<p> 计算完成,LOSline03查看</p>");
}
});
});
$(".No4point").click(function (event) {
$(window).unbind("dblclick");
$("#result02").html("<p> 正在计算Buffer,请等待...</p>");
$.ajax({
url: '/Buffer01',
data: {
a3: $('#aa').html(),
b3: $('#bb').html(),
c3: $('#cc').html(),
d3: $('#dd').html()
},
dataType: 'JSON',
type: 'GET',
success: function (responseText, status, xhr) {
if (responseText != '') {
$("#result02").html("<p> 计算完成,Buffer01查看</p>");
} else {
$('#result02').html("<p> error</p>");
}
}
});
});
});
}
getPosition();
ArcServer服务加载模块:
在F:\ARCGISDATA\python\templates目录下新建3个txt文件
LOSlineremove.txt;Buffer01.txt; 80LOSline01.txt
LOSlineremove.txt
    <script>
   viewer.imageryLayers.removeAll();
            var ArcGisMap = new Cesium.ArcGisMapServerImageryProvider({
                url: "http://services.arcgisonline.com/ArcGIS/rest/services/World_Imagery/MapServer"
            });
            viewer.imageryLayers.addImageryProvider(ArcGisMap).alpha = 1;
    </script>
Buffer01.txt
    <script>

    var esriproviderBuffer01 = new Cesium.ArcGisMapServerImageryProvider({
            url: 'https://localhost:6443/arcgis/rest/services/Buffer02/MapServer'
        });
    viewer.imageryLayers.addImageryProvider(esriproviderBuffer01).alpha = 1;

    </script>
80LOSline01.txt
    <script>
    var esriprovider8001 = new Cesium.ArcGisMapServerImageryProvider({
        url: 'https://localhost:6443/arcgis/rest/services/80LOSline01/MapServer'
    });
    viewer.imageryLayers.addImageryProvider(esriprovider8001).alpha = 1;
    </script>
展示模块:
    $(function () {
        $('button#buttonLOS03').click(function (event) {
            $.ajax({
                url: "/80LOSline01.txt",
                success: function (responseText, status, xhr) {
                    if (responseText != '') {
                        $('.LOSscri').html(responseText);
                    } else {
                        $('.LOSscri').html("<li>没有搜索到</li>");
                    }
                }
            })
        });
        $('button#buttonBuffer01').click(function (event) {
            $.ajax({
                url: "/Buffer01.txt",
                success: function (responseText, status, xhr) {
                    if (responseText != '') {
                        $('.LOSscribuffer').html(responseText);
                    } else {
                        $('.LOSscribuffer').html("<li>没有搜索到</li>");
                    }
                }
            })
        });
        $('button#LOSCLEAR').click(function (event) {
            //alert("键盘键松开触发,HTML: " + $('#search').val());
            $.ajax({
                url: "/LOSlineremove.txt",    //  请求路径
                // type: "GET", //请求方式
                // data: $("form").serialize(),//请求参数
                success: function (responseText, status, xhr) {//异步执行成功执行的回调函数
                   $('.LOSscri').html(responseText);//地图上打标志
                }
            })
        });
    });
2.3成果

3后端Python框架搭建
FLASK框架教程:http://docs.jinkan.org/docs/flask/quickstart.html
ArcPy帮助文档:http://desktop.arcgis.com/zh-cn/arcmap/latest/analyze/arcpy/what-is-arcpy-.htm
3.1地理分析功能编写——通视分析,缓冲区分析,高斯投影
通视分析
新建run.py文件,写入以下代码
#coding:utf-8
from flask import Flask, render_template, request, jsonify
import arcpy
from arcpy import env
# 自定义函数
from LonLat2XYpy2 import lonlat2xy
from Buffer_anatest import buffertest

/////////////////

# 鼠标点击地图,通视分析
@app.route('/oneLinetoLOS02')
def oneLinetoLOS02():
    print("LOSana start")
    # point_start = [93342.212,4308755.437]
    # point_end = [93325.940, 4308611.767]
    aa = request.args.get("a2", 0, type=float)
    # print('aa: %s '%aa)
    bb = request.args.get("b2", 0, type=float)
    cc = request.args.get("c2", 0, type=float)
    dd = request.args.get("d2", 0, type=float)
    pointstart = lonlat2xy(aa, bb)
    pointend = lonlat2xy(cc, dd)
    # print('point_start: %s ' % (pointstart,))
    # print('point_end: %s ' % (pointend,))
    line01 = [pointstart, pointend]
    line02 = [pointstart, pointend]
    feature_info = [line01, line02]
    # print('line01: %s '%line01)
    features = []
    for feature in feature_info:
        features.append(
            arcpy.Polyline(
                arcpy.Array([arcpy.Point(*coords) for coords in feature])))
    # Set workspace
    env.workspace = "F:/ARCGISDATA"
    # Execute Delete
    LOSline01 = "80LOSline01.shp"
    arcpy.Delete_management(LOSline01)
    LOSposition = "80LOSposition01.shp"
    arcpy.Delete_management(LOSposition)
    insurface01 = "alltif1.tif"
    inline01 = features
    outlos01 = "80LOSline01.shp"
    outobs01 = "80LOSposition01.shp"
    # print('in_line01: %s '%inline01)
    arcpy.LineOfSight_3d(insurface01, inline01, outlos01, outobs01)
    print("LOSana end")
    return jsonify(result=line02)
缓冲区分析
新建Buffer_anatest.py
# Import system modules
import arcpy
from arcpy import env

def buffertest(p1,p2):
    print("buffertest start")
    env.workspace = "F:/ARCGISDATA"
    line01 = [p1, p2]
    line02 = [p2, p1]
    feature_info = [line01, line02]
    # print('line01: %s ' % line01)
    features = []
    for feature in feature_info:
            features.append(
                arcpy.Polyline(
                    arcpy.Array([arcpy.Point(*coords) for coords in feature])))
    # Set local variables
    infeatures = features
    outfeatures = "bufferana2.shp"
    bufferDistance = 30
    # Execute Buffer
    arcpy.Buffer_analysis(infeatures, outfeatures, bufferDistance)
    print("buffertest end")
    return 1
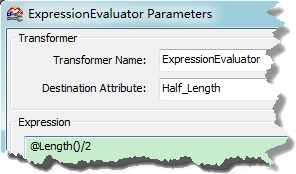
高斯投影函数:(由于在arcmap处理地图时,使用的Xian_80投影坐标系,所以这里需要做经纬度坐标转投影坐标)
LatLon2XYpy2.py
# coding:utf-8
# 参考文献《基于高斯投影的经纬度距离参数修正方法》
import math

def lonlat2xy(longitude, latitude):
    # WGS-84
    # b = 6356752.3142
    # c = 6399593.6258
    # alpha = 1 / 298.257223563
    # e2 = 0.0066943799013
    # epep = 0.00673949674227

    # 80
    a = 6378140.0
    # b = 6356755.288157528
    e1 = 0.00669438499959
    e2 = 0.00673950181947
    # alpha = 1 / 298.2570
    B = (math.pi / 180.0) * latitude
    Lcm = 126.0 # Central_Meridian: 126.0
    tsin = math.sin(B)
    tcos = math.cos(B)
    t = math.tan(B)
    A = (math.pi / 180.0) * (longitude - Lcm) * tcos
    C = e2 * pow(tcos, 2)
    M = a * ((1 - e1 / 4.0 - pow(e1, 2) * 3.0 / 64.0 - pow(e1, 3) * 5.0 / 256.0) * B
        - (pow(e1, 2) * 3.0 / 8.0 + pow(e1, 2) * 3.0 / 32.0 + pow(e1, 3) * 45.0 / 1024.0) * math.sin(2.0 * B)
        + (pow(e1, 2) * 15.0 / 256.0 + pow(e1, 3) * 45.0 / 1024.0) * math.sin(4.0 * B)
        - pow(e1, 3) * 35.0 / 3072.0 * math.sin(6 * B))
    N = a / math.sqrt(1 - e1 * pow(tsin, 2))
    # zi dai pian yi - 15535.6 i dont know
    y = - 15535.6 + M + N * t * (0.5 * pow(A, 2) + (5.0 - pow(t, 2) + 9.0 * C + 4 * pow(C, 2)) * pow(A, 4) / 24.0
        + (61.0 - 58.0 * pow(t, 2) + pow(t, 4) + 270 * C -330 * pow(t, 2) * C) * pow(A, 6) / 720.0)
    x = 500000.0 + N * (A + (1.0 - pow(t, 2) + C) * pow(A, 3) / 6.0
        + (5.0 - 18.0 * pow(t, 2) + pow(t, 4) + 14.0 * C - 58.0 * C * pow(t, 2)) * pow(A, 5) / 120.0)
    # x0 = 4309134.741- x
    # y0 = 92760.635 - y
    # return x0, y0,x ,y
    return x, y
3.2 Flask服务主文件编写
在run.py中加入以下代码,下面展示完整run.py文件
#coding:utf-8
from flask import Flask, render_template, request, jsonify
import arcpy
from arcpy import env
# 自定义函数
from LonLat2XYpy2 import lonlat2xy
from Buffer_anatest import buffertest

app = Flask(__name__)

@app.route('/')
def hello():
    return '<h1>Hello World</h1>'

@app.route('/80LOSline01.txt')
def txt01():
    return render_template('80LOSline01.txt')

@app.route('/Buffer01.txt')
def txt02():
    return render_template('Buffer01.txt')

@app.route('/LOSlineremove.txt')
def txt03():
    return render_template('LOSlineremove.txt')

# 地图主界面
@app.route('/Intro_Cesium_python.html')
def los():
    return render_template('Cesium_python.html')

# 鼠标点击地图,通视分析
@app.route('/oneLinetoLOS02')
def oneLinetoLOS02():
    print("LOSana start")
    # point_start = [93342.212,4308755.437]
    # point_end = [93325.940, 4308611.767]
    aa = request.args.get("a2", 0, type=float)
    # print('aa: %s '%aa)
    bb = request.args.get("b2", 0, type=float)
    cc = request.args.get("c2", 0, type=float)
    dd = request.args.get("d2", 0, type=float)
    pointstart = lonlat2xy(aa, bb)
    pointend = lonlat2xy(cc, dd)
    # print('point_start: %s ' % (pointstart,))
    # print('point_end: %s ' % (pointend,))
    line01 = [pointstart, pointend]
    line02 = [pointstart, pointend]
    feature_info = [line01, line02]
    features = []
    for feature in feature_info:
        features.append(
            arcpy.Polyline(
                arcpy.Array([arcpy.Point(*coords) for coords in feature])))
    # Set workspace
    env.workspace = "F:/ARCGISDATA"
    # Execute Delete
    LOSline01 = "80LOSline01.shp"
    arcpy.Delete_management(LOSline01)
    LOSposition = "80LOSposition01.shp"
    arcpy.Delete_management(LOSposition)
    insurface01 = "alltif1.tif"
    inline01 = features
    outlos01 = "80LOSline01.shp"
    outobs01 = "80LOSposition01.shp"
    arcpy.LineOfSight_3d(insurface01, inline01, outlos01, outobs01)
    print("LOSana end")
    return jsonify(result=line02)

# 鼠标点击地图-缓冲区分析
@app.route('/Buffer01')
def Buffer01():
    print("Buffer01 start")
    aa = request.args.get("a3", 0, type=float)
    bb = request.args.get("b3", 0, type=float)
    cc = request.args.get("c3", 0, type=float)
    dd = request.args.get("d3", 0, type=float)
    pointstart = lonlat2xy(aa, bb)
    pointend = lonlat2xy(cc, dd)
    Bufline01 = "bufferana2.shp"
    arcpy.Delete_management(Bufline01)
    print("jieguo start")
    jieguo = buffertest(pointstart, pointend)
    print("jieguo end")
    return jsonify(result=jieguo)

if __name__ == '__main__':
    app.run(debug = True)
3.3 运行run.py
使用Pycharm打开F:\ARCGISDATA\文件夹
点击File —> Default Settings… —> 添加Flask模块,添加Python2.7路径
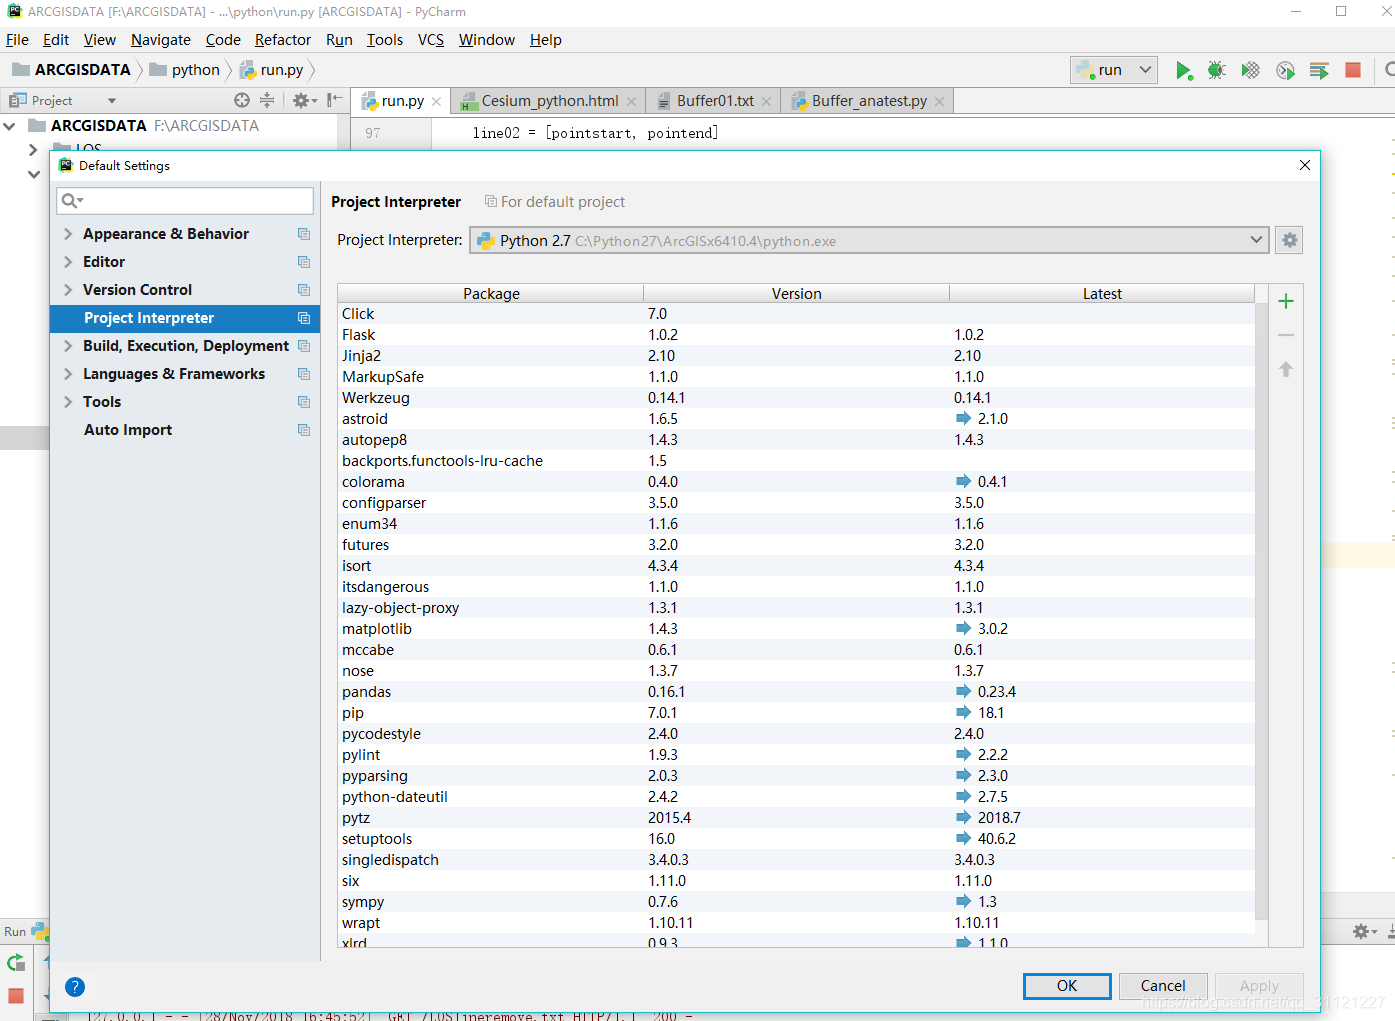
右击run.py,点击Run‘run’,结果如下
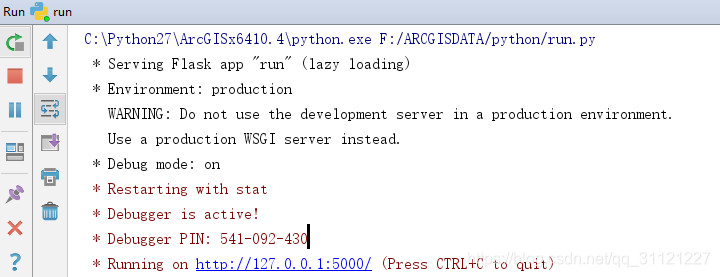
在浏览器输入http://127.0.0.1:5000/Intro_Cesium_python.html
即可访问网页
转载自:https://blog.csdn.net/qq_31121227/article/details/84583736