GeoServer发布Heatmap
目录
百度等热力图是使用开源的heatmap.js做的,但是这种解决方案的缺陷是:
1 数据量大的话,从前端通过后台查询比较费时,比如arcserver默认设置返回1000条查询记录,3000条就很卡了,对动辄上万多数据可行性不高。
2 前端对大数据添加渲染压力也大。
如果所有的数据在服务端生成渲染图片输出到前端,这两个问题都迎刃而解。
本文便阐述如何使用geoserer在服务端生成热力图,返回前端地图显示。
一 环境部署
正常部署geoserver,本次版本是2.6
下载地址:http://geoserver.org/release/stable/
另外要下载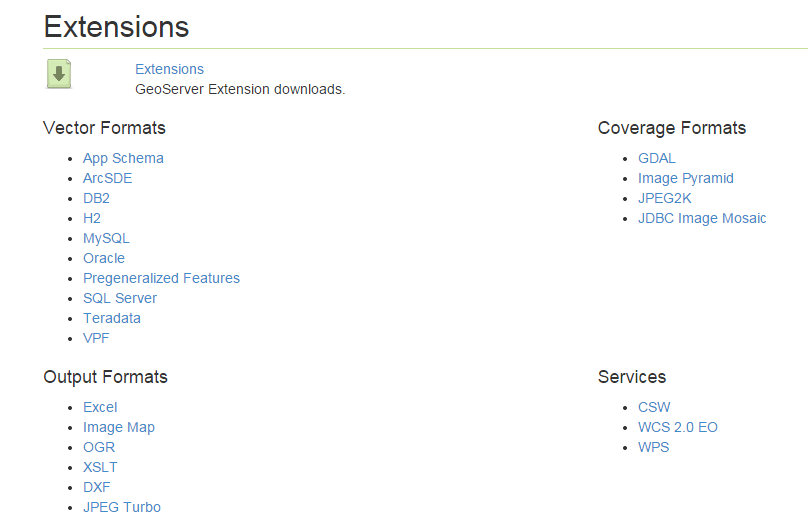
Extensions的wps扩展插件。
解压wps,将jar包放进geoserver部署的web-INF/lib中,重启geoserver。
二 生成热力图的样式文件heatmap.sld
<?xml version="1.0" encoding="ISO-8859-1"?>
   <StyledLayerDescriptor version="1.0.0"
       xsi:schemaLocation="http://www.opengis.net/sld StyledLayerDescriptor.xsd"
       xmlns="http://www.opengis.net/sld"
       xmlns:ogc="http://www.opengis.net/ogc"
       xmlns:xlink="http://www.w3.org/1999/xlink"
       xmlns:xsi="http://www.w3.org/2001/XMLSchema-instance">
     <NamedLayer>
       <Name>Heatmap</Name>
       <UserStyle>
         <Title>Heatmap</Title>
         <Abstract>A heatmap surface showing population density</Abstract>
         <FeatureTypeStyle>
           <Transformation>
             <ogc:Function name="gs:Heatmap">
               <ogc:Function name="parameter">
                 <ogc:Literal>data</ogc:Literal>
               </ogc:Function>
               <ogc:Function name="parameter">
                 <ogc:Literal>weightAttr</ogc:Literal>
                 <ogc:Literal>jan_je</ogc:Literal>
               </ogc:Function>
               <ogc:Function name="parameter">
                 <ogc:Literal>radiusPixels</ogc:Literal>
                 <ogc:Function name="env">
                   <ogc:Literal>radius</ogc:Literal>
                   <ogc:Literal>100</ogc:Literal>
                 </ogc:Function>
               </ogc:Function>
               <ogc:Function name="parameter">
                 <ogc:Literal>pixelsPerCell</ogc:Literal>
                 <ogc:Literal>10</ogc:Literal>
               </ogc:Function>
               <ogc:Function name="parameter">
                 <ogc:Literal>outputBBOX</ogc:Literal>
                 <ogc:Function name="env">
                   <ogc:Literal>wms_bbox</ogc:Literal>
                 </ogc:Function>
               </ogc:Function>
               <ogc:Function name="parameter">
                 <ogc:Literal>outputWidth</ogc:Literal>
                 <ogc:Function name="env">
                   <ogc:Literal>wms_width</ogc:Literal>
                 </ogc:Function>
               </ogc:Function>
               <ogc:Function name="parameter">
                 <ogc:Literal>outputHeight</ogc:Literal>
                 <ogc:Function name="env">
                   <ogc:Literal>wms_height</ogc:Literal>
                 </ogc:Function>
               </ogc:Function>
             </ogc:Function>
           </Transformation>
          <Rule>
            <RasterSymbolizer>
            <!-- specify geometry attribute to pass validation -->
              <Geometry>
                <ogc:PropertyName>geom</ogc:PropertyName></Geometry>
              <Opacity>0.6</Opacity>
				<ColorMap type="ramp" >
                <ColorMapEntry color="#0000FF" quantity="0" label="nodata" opacity="0"/>
                <ColorMapEntry color="#00FFFF" quantity="0.02" label="nodata"
                  opacity="0"/>
                <ColorMapEntry color="#00FF00" quantity=".1" label="nodata"/>
                <ColorMapEntry color="#FFFF00" quantity=".5" label="values" />
                <ColorMapEntry color="#FF0000" quantity="1.0" label="values" />
              </ColorMap>
            </RasterSymbolizer>
           </Rule>
         </FeatureTypeStyle>
       </UserStyle>
     </NamedLayer>
</StyledLayerDescriptor>而<ogc:PropertyName>geom</ogc:PropertyName></Geometry>这里是指定渲染的图形字段,查看数据库空间数据表的图形字段名称,如果是geom就写geom,如果是the_geom就写the_geom,根据自己数据库中图形字段名称来。在geoserver>styles中发布这样的一个sld文件。三 测试
3.1 使用geoserver发布一个点图层,加载sld

default style那设置发布的sld文件。
确定,发布。
3.2 openlayer加载wms点图层
<?xml version="1.0" encoding="UTF-8"?>
<!DOCTYPE HTML PUBLIC "-//W3C//DTD XHTML 1.0 Strict//EN" "DTD/xhtml1-strict.dtd">
<html xmlns="http://www.w3.org/1999/xhtml">
<head>
<title>热力图展示</title>
<!-- Import OL CSS, auto import does not work with our minified OL.js build -->
<!--<link rel="stylesheet" type="text/css" href="http://localhost:8090/geoserver/openlayers/theme/default/style.css"/>-->
    <link rel="stylesheet" href="openlayers/theme/default/style.css" type="text/css">
    <script src="openlayers/OpenLayers.js"></script>
<!-- Basic CSS definitions -->
<style type="text/css">
    /* General settings */
    body {
        font-family: Verdana, Geneva, Arial, Helvetica, sans-serif;
        font-size: small;
    }

    /* The map and the location bar */
    #map {
        clear: both;
        position: relative;
        width: 1000px;
        height: 600px;
        border: 1px solid black;
    }

</style>
<!-- Import OpenLayers, reduced, wms read only version -->
<!--<script src="http://localhost:8090/geoserver/openlayers/OpenLayers.js" type="text/javascript"></script>-->
<script defer="defer" type="text/javascript">
var map;
var untiled;


// pink tile avoidance
OpenLayers.IMAGE_RELOAD_ATTEMPTS = 5;
// make OL compute scale according to WMS spec
OpenLayers.DOTS_PER_INCH = 25.4 / 0.28;

function init(){
    // if this is just a coverage or a group of them, disable a few items,
    // and default to jpeg format
    format = 'image/png';

    var bounds = new OpenLayers.Bounds(
            13218259.7875, 3713786.7208,
            13355533.9608, 3805832.0664
    );
    var options = {
        controls: [],
        maxExtent: bounds,
        maxResolution: 536.2272394531246,
        projection: "EPSG:3857",
        units: 'm'
    };
    map = new OpenLayers.Map('map', options);


    // setup tiled layer
    /*
    tiled = new OpenLayers.Layer.WMS(
            "cite:v_zhenjiang - Tiled", "http://localhost:8090/geoserver/cite/wms",
            {
                "LAYERS": 'cite:v_zhenjiang',
                "STYLES": '',
                format: format
            },
            {
                buffer: 0,
                displayOutsideMaxExtent: true,
                isBaseLayer: true,
                yx : {'EPSG:3857' : false}
            }
    );*/

    // setup single tiled layer
    untiled = new OpenLayers.Layer.WMS(
            "cite:v_zhenjiang - Untiled", "http://localhost:8090/geoserver/cite/wms",
            {
                "LAYERS": 'cite:v_zhenjiang',
                "transparent":"TRUE",
                "STYLES": '',
                format: format
            },
            {
                singleTile: true,
                ratio: 1,
                isBaseLayer: false,
                yx : {'EPSG:3857' : false}
            }
    );

    var osmlayer = new OpenLayers.Layer.OSM( "osm");
    map.addLayers([untiled,osmlayer]);
    // build up all controls
    map.addControl(new OpenLayers.Control.PanZoomBar({
        position: new OpenLayers.Pixel(2, 15)
    }));
    map.addControl(new OpenLayers.Control.Navigation());
    map.addControl(new OpenLayers.Control.MousePosition());
    map.addControl(new OpenLayers.Control.LayerSwitcher());
    map.zoomToExtent(bounds);
    /*map.setCenter(
            new OpenLayers.LonLat(119.45, 32.2).transform(
                    new OpenLayers.Projection("EPSG:4326"),
                    map.getProjectionObject()
            ), 15
    );*/

}

</script>
</head>
<body onload="init()">

<div id="map">

</div>
</body>
</html>
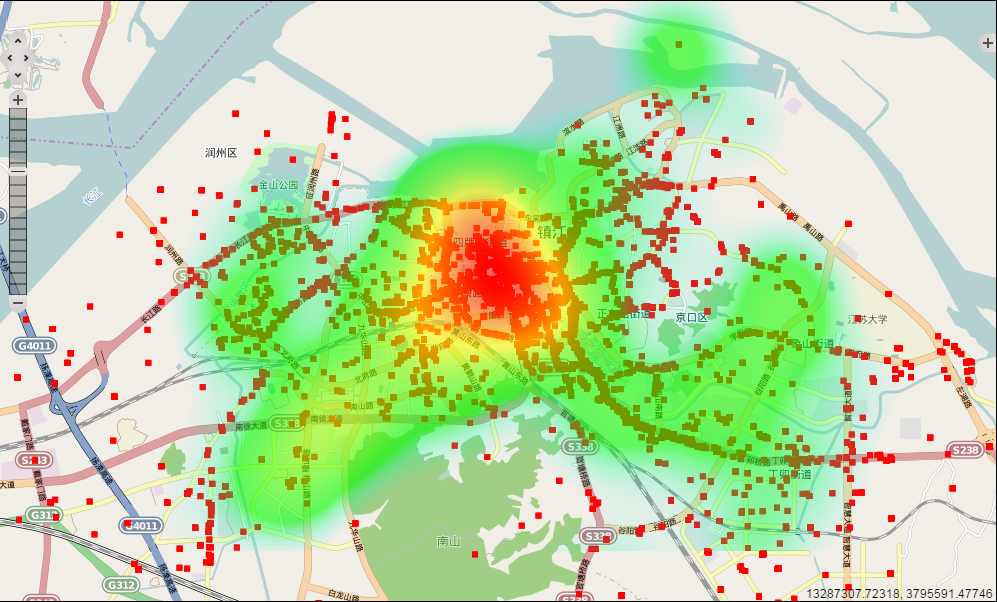
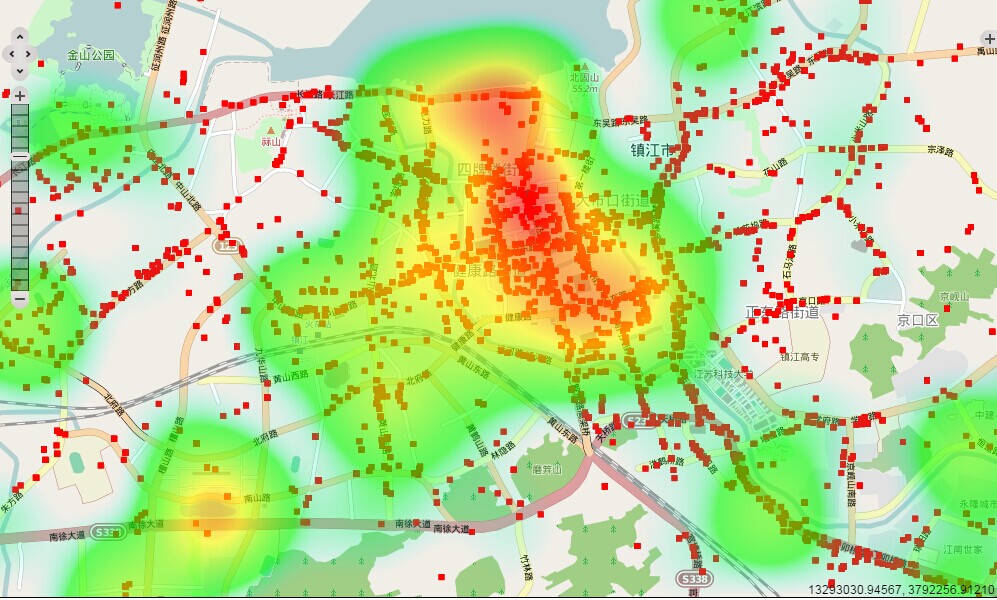
四 效果图
转载自:https://blog.csdn.net/freeland1/article/details/41046691