
OpenLayer4调用GeoServer发布的矢量切片
首先设置矢量切片数据源,可以选择pbf格式或者geojson格式,其中pbf格式数据加密性较好,读取速度快:
var vector = new ol.layer.VectorTile({
            source: new ol.source.VectorTile({
                projection: projection4326,
                <!-- format: new ol.format.GeoJSON(), -->//geojson格式
                format: new ol.format.MVT(),//pbf格式
                tileGrid: ol.tilegrid.createXYZ({
                    extent: ol.proj.get('EPSG:4326').getExtent(),
                    maxZoom: 32
                }),
                tilePixelRatio: 1,
                // 矢量切片服务地址
                tileUrlFunction: function(tileCoord){
                    return 'http://127.0.0.1:8080/geoserver/gwc/service/tms/1.0.0/'
                        +lyr+'@EPSG%3A4326@pbf/'+(tileCoord[0]-1)
                        + '/'+tileCoord[1] + '/' + (Math.pow(2,tileCoord[0]-1)+tileCoord[2]) + '.pbf';//pbf矢量切片
                }
                <!-- tileUrlFunction: function(tileCoord){   -->
                    <!-- return 'http://127.0.0.1:8080/geoserver/gwc/service/tms/1.0.0/'   -->
                        <!-- +lyr+'@EPSG%3A4326@geojson/'+(tileCoord[0]-1)   -->
                        <!-- + '/'+tileCoord[1] + '/' + (Math.pow(2,tileCoord[0]-1)+tileCoord[2]) + '.geojson'; -->
                <!-- }               -->//geojson矢量切片
            })
            <!-- style:initStyle  -->
        });
设置Map对象,并自定义矢量切片符号:
//设置POI图标
        var iconStyle = new ol.style.Style({
                            image: new ol.style.Icon(/** @type {olx.style.IconOptions} */ ({
                              anchor: [0.5, 46],
                              anchorXUnits: 'fraction',
                              anchorYUnits: 'pixels',
                              src: 'https://openlayers.org/en/v4.6.4/examples/data/icon.png'
                            }))
                        });
//设置Map对象
var map = new ol.Map({
            layers: [
                vector
            ],
            target: 'map',
            controls: ol.control.defaults().extend([
                new ol.control.MousePosition({
                    className:"ol-mouseposition",
                    coordinateFormat: ol.coordinate.createStringXY(5)
                })
            ]),
            view: new ol.View({
                projection: projection4326,
                minZoom:1,
                maxZoom:32,
                center: [-103.774,44.440],
                zoom: 8
            })
        });
//将默认样式切换成自定义符号
vector.setStyle(iconStyle);
具体效果如下图所示:
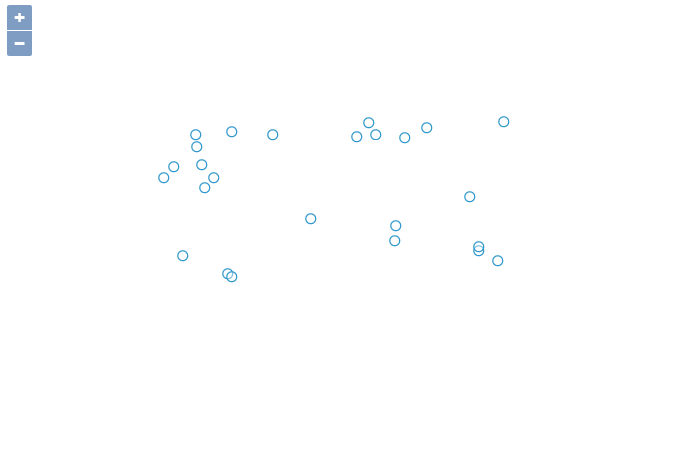
默认样式效果图
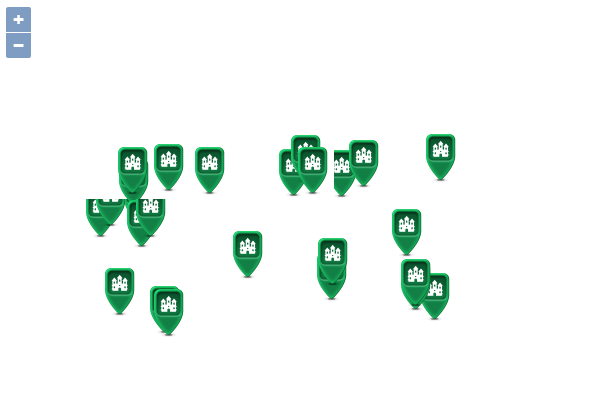
动态渲染效果图
转载自:https://blog.csdn.net/weixin_33759269/article/details/87029725

