
巧用Arcgis Server的REST接口实现OL2中WMS添加过滤
目录
概述:
在实际的应用中,很多时候我们需要对展示的图层进行属性或者空间的过滤,在Geoserver发布的WMS中,可以通过CQL_FILTER来设置过滤条件,但是Arcgis Server发布的WMS不支持CQL_FILTER的过滤,这样就无法实现对展示的图层进行过滤。好在Arcgis Server的REST接口中,EXPORT接口实现了图层的导出功能,并可添加过滤条件,借于此,本文通过扩展OL2图层,结合EXPORT接口,实现Geoserver中CQL_FILTER的功能。
EXPORT接口介绍:
export接口所需参数如下图所示:
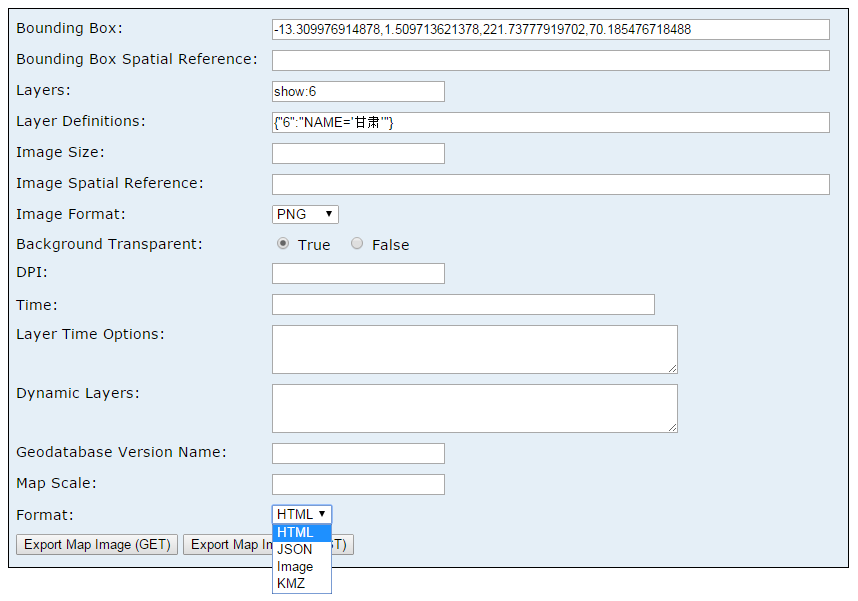
在上述的参数中,有以下几个参数是实现中必须的:
1、bbox:
地图生成的四至,中间以逗号隔开(eg:-13.309976914878,1.509713621378,221.73777919702,70.185476718488)。
2、layers:
地图需要展示的图层,是按照rest的顺序,不是WMS的顺序(eg:show:6)。
3、layerDefs:
图层的过滤条件,6为展示的图层,后面为过滤条件(eg:{“6″:”NAME=’甘肃'”})。
4、size:
图片的输出大小,前面为宽度,后面为高度,中间以逗号隔开(eg:1956,571)。
5、format:
输出的图片格式,透明状态下必须为png。
6、transparent:
是否以透明输出,是,true;否,false。
7、f:
输出格式,默认为html,本例中格式必须为image。
具体参数说明如下:
| Parameter | Details |
|---|---|
| f | Description: The response format. The default response format is html. If the format is image, the image bytes are directly streamed to the client.
Values: html | json | image | kmz |
| bbox | Required Description: The extent (bounding box) of the exported image. Unless the bboxSR parameter has been specified, the bbox is assumed to be in the spatial reference of the map.
Syntax: Example: The |
| size | Description: The size (width * height) of the exported image in pixels. If the size is not specified, an image with a default size of 400 * 400 will be exported.
Syntax: Example: |
| dpi | Description: The device resolution of the exported image (dots per inch). If the dpi is not specified, an image with a default DPI of 96 will be exported.
Example: |
| imageSR | Description: The spatial reference of the exported image.
The spatial reference can be specified as either a well-known ID or as a spatial reference json object. If the |
| bboxSR | Description: The spatial reference of the bbox.
The spatial reference can be specified as either a well-known ID or as a spatial reference json object. If the |
| format | Description: The format of the exported image. The default format is png.
Values: png | png8 | png24 | jpg | pdf | bmp | gif | svg | png32 Note: Support for the |
| layerDefs | Description: Allows you to filter the features of individual layers in the exported map by specifying definition expressions for those layers. Definition expression for a layer that is published with the service will be always honored.
Simple Syntax:Syntax:
layerId1:layerDef1;layerId2:layerDef2where layerId1, layerId2 are the layer ids returned by the map service resource
Example: JSON Syntax (New in 10):You can also use a JSON representation for Layer Definitions. Syntax: { "<layerId1>" : "<layerDef1>" , "<layerId2>" : "<layerDef2>" }where Example: {"0":"POP2000 > 1000000","5":"AREA > 100000"} |
| layers | Description: Determines which layers appear on the exported map. There are four ways to specify which layers are shown:
Syntax: [show | hide | include | exclude]:layerId1,layerId2 Example: layers=show:2,4,7 |
| transparent | Description: If true, the image will be exported with the background color of the map set as its transparent color. The default is false. Only the png and gif formats support transparency. Internet Explorer 6 does not display transparency correctly for png24 image formats.
Values: true | false |
| time | Description: The time instant or the time extent of the exported map image.
Time instant Syntax: Time extent Syntax: |
| layerTimeOptions | Description: The time options per layer. Users can indicate whether or not the layer should use the time extent specified by the timeparameter or not, whether to draw the layer features cumulatively or not and the time offsets for the layer.
Syntax: {
"<layerId1>" : {
//If
Example: {
"0" : {
"useTime" : true,
"timeDataCumulative" : false,
"timeOffset" : 1,
"timeOffsetUnits" : "esriTimeUnitsYears"
},
"3" : {
"useTime" : false
}
}
|
| dynamicLayers | //This option was added at 10.1
Description: Use The order of Note:
Syntax: [
{
"id": <layerOrTableId>,
"source": <layer source>,
"definitionExpression": "<definitionExpression>",
"drawingInfo":
{
"renderer": <renderer>,
"transparency": <transparency>,
"scaleSymbols": <true | false >,
"showLabels": <true | false >,
"labelingInfo": <labeling info>
},
"layerTimeOptions":
{
"useTime" : <true | false>,
"timeDataCumulative" : <true | false>,
"timeOffset" : <timeOffset>,
"timeOffsetUnits" : "<esriTimeUnitsCenturies | esriTimeUnitsDays | esriTimeUnitsDecades |
esriTimeUnitsHours | esriTimeUnitsMilliseconds | esriTimeUnitsMinutes |
esriTimeUnitsMonths | esriTimeUnitsSeconds | esriTimeUnitsWeeks | esriTimeUnitsYears |
esriTimeUnitsUnknown>"
}
},
{
"id": <layerOrTableId>,
"source": <layer source>,
"definitionExpression": "<definitionExpression>",
"drawingInfo":
{
"renderer": <renderer>,
"transparency": <transparency>,
"scaleSymbols": <true | false >,
"showLabels": <true | false >,
"labelingInfo": <labeling info>
},
"layerTimeOptions":
{
"useTime" : <true | false>,
"timeDataCumulative" : <true | false>,
"timeOffset" : <timeOffset>,
"timeOffsetUnits" : "<esriTimeUnitsCenturies | esriTimeUnitsDays | esriTimeUnitsDecades |
esriTimeUnitsHours | esriTimeUnitsMilliseconds | esriTimeUnitsMinutes |
esriTimeUnitsMonths | esriTimeUnitsSeconds | esriTimeUnitsWeeks | esriTimeUnitsYears |
esriTimeUnitsUnknown>"
}
}
]
Example: [ //disable time on existing map service layer and turn off labels { "id": 501, "source": { "type": "mapLayer", "mapLayerId": 0 }, "drawingInfo": { "showLabels": false }, "layerTimeOptions": { "useTime": false } }, //add a new layer from registered workspace and label features with a feature attribute value {TaxLotId] { "id": 502, "source": { "type": "dataLayer", "dataSource": { "type": "table", "workspaceId": "MAP", "dataSourceName": "MAP.user1.Taxlots" } }, "drawingInfo": { "renderer": { "type": "simple", "symbol": { "type" : "esriSFS", "style" : "esriSFSSolid", "color" : [166,36,0,255], "outline" : { "type" : "esriSLS", "style" : "esriSLSSolid", "color" : [110,110,110,255], "width" : 1.0 } }, "label": "TaxLots", "description": "" }, "transparency": 60 }, "showLabels": true, "labelingInfo": [ { "labelPlacement": "esriServerPolygonPlacementAlwaysHorizontal", "labelExpression": "[TaxLotId]", "useCodedValues": false, "symbol": { "type": "esriTS", "color": [255,255,0,255], "verticalAlignment": "bottom", "horizontalAlignment": "left", "font": { "family": "Arial", "size": 12, "style": "normal", "weight": "bold", "decoration": "none" } }, "minScale": 15000, "maxScale": 30000, "where": "" } ] }, //change the Version of existing map service layer { "id": 503, "source": { "type": "mapLayer", "mapLayerId": 1, "gdbVersion": "USER1" }, "definitionExpression": "neighborhood = 'French Quarter'" }, //add a raster from registered workspace { "id": 504, "source": { "type": "dataLayer", "dataSource": { "type": "raster", "workspaceId": "rasterWS", "dataSourceName": "NewOrleans.tif" } }, "drawingInfo": { "transparency": 0 } } ] |
| gdbVersion | //This option was added at 10.1
Description: Use this parameter to specify the geodatabase version. Syntax: gdbVersion=<geodatabase version>
Example: gdbVersion=sde.USER1
|
| mapScale | //This option was added at 10.1
Description: Use this parameter to export a map image at a specific scale, with the map centered around the center of the specified bounding box ( Syntax: mapScale=<scale>
Examples: mapScale=5000000
mapScale=5E6 |
实现:
1、扩展的AgsRestWMS图层
OpenLayers.Layer.AgsRestWMS = OpenLayers.Class(OpenLayers.Layer.Grid, {
    DEFAULT_PARAMS: { service: "WMS",
                      version: "1.1.1",
                      request: "GetMap",
                      styles: "",
                      format: "image/jpeg"
                     },

    isBaseLayer: true,
    encodeBBOX: false,
    noMagic: false,
    layers:"",
    filter:"",
    yx: {},
    initialize: function(name, url, params, options) {
        var newArguments = [];
        params = OpenLayers.Util.upperCaseObject(params);
        this.layers = params.LAYERS;
        this.filter=params.FILTER;
        if (parseFloat(params.VERSION) >= 1.3 && !params.EXCEPTIONS) {
            params.EXCEPTIONS = "INIMAGE";
        }
        newArguments.push(name, url, params, options);
        OpenLayers.Layer.Grid.prototype.initialize.apply(this, newArguments);
        OpenLayers.Util.applyDefaults(
                       this.params,
                       OpenLayers.Util.upperCaseObject(this.DEFAULT_PARAMS)
                       );

        if (!this.noMagic && this.params.TRANSPARENT &&
            this.params.TRANSPARENT.toString().toLowerCase() == "true") {
            if ( (options == null) || (!options.isBaseLayer) ) {
                this.isBaseLayer = false;
            }
            if (this.params.FORMAT == "image/jpeg") {
                this.params.FORMAT = OpenLayers.Util.alphaHack() ? "image/gif"
                                                                 : "image/png";
            }
        }

    },
    reverseAxisOrder: function() {
        var projCode = this.projection.getCode();
        return parseFloat(this.params.VERSION) >= 1.3 &&
            !!(this.yx[projCode] || (OpenLayers.Projection.defaults[projCode] &&
            OpenLayers.Projection.defaults[projCode].yx));
    },
    getURL: function (bounds) {
        bounds = this.adjustBounds(bounds);
        var imageSize = this.getImageSize();
        var newParams = {};
        var reverseAxisOrder = this.reverseAxisOrder();
        newParams.BBOX = this.encodeBBOX ?
            bounds.toBBOX(null, reverseAxisOrder) :
            bounds.toArray(reverseAxisOrder);
        newParams.WIDTH = imageSize.w;
        newParams.HEIGHT = imageSize.h;
        var requestString = this.getFullRequestString(newParams);
        return requestString;
    },
    getFullRequestString:function(newParams) {
    	var url = this.url;
        if (OpenLayers.Util.isArray(url)) {
            url = this.selectUrl(s, url);
        }
        url = url+'?bbox=${bbox}&layers=${layers}&layerDefs=${layerDefs}&size=${size}&format=png&transparent=true&f=image';
        var layers = "show:"+this.layers;
        var layerDefs = '{"'+this.layers+'":"'+this.filter+'"}';
        url = OpenLayers.String.format(url, {
        	'bbox': newParams.BBOX.toString(),
        	'layers': layers,
        	'layerDefs': layerDefs,
        	'size':newParams.WIDTH+","+newParams.HEIGHT
        });
        return url;
    },
    CLASS_NAME: "OpenLayers.Layer.AgsRestWMS"
});
2、前台调用
<!DOCTYPE html>
<html>
<head lang="en">
<meta charset="UTF-8">
<title>openlayers map</title>
<link rel="stylesheet" href="../../../plugin/OpenLayers-2.13.1/theme/default/style.css" type="text/css">
<style>
html, body, #map{
padding:0;
margin:0;
height:100%;
width:100%;
overflow: hidden;
}
</style>
<script src="../../../plugin/OpenLayers-2.13.1/OpenLayers.js"></script>
<script src="extend/AgsRestWMS.js"></script>
<script src="../../../plugin/jquery/jquery-1.8.3.js"></script>
<script>
var map;
$(window).load(function() {
var format = 'image/png';
var bounds = new OpenLayers.Bounds(
73.45100463562233, 18.16324718764174,
134.97679764650596, 53.531943152223576
);
var options = {
controls: [],
maxExtent: bounds,
maxResolution: 0.2403351289487642,
projection: "EPSG:4326",
units: 'degrees'
};
map = new OpenLayers.Map('map', options);
var base1 = new OpenLayers.Layer.WMS(
"base1",
"http://localhost:8088/geoserver/lzugis/wms",
{
"LAYERS": 'province',
format: format,
transparent: true,
CQL_FILTER:"dzm='620000'"
},
{
isBaseLayer: true,
singleTile: true
}
);
var base2 = new OpenLayers.Layer.AgsRestWMS(
"base2",
"http://localhost:6080/arcgis/rest/services/lzugis/boundrychina/MapServer/export",
{
"LAYERS": '6',
format: format,
transparent: true,
filter:"dzm='620000'"
},
{
isBaseLayer: true,
singleTile: true
}
);
map.addLayers([base1,base2]);
map.addControl(new OpenLayers.Control.Zoom());
map.addControl(new OpenLayers.Control.Navigation());
map.addControl(new OpenLayers.Control.OverviewMap());
map.addControl(new OpenLayers.Control.LayerSwitcher());
map.zoomToExtent(bounds);
});
</script>
</head>
<body>
<div id="map"></div>
</body>
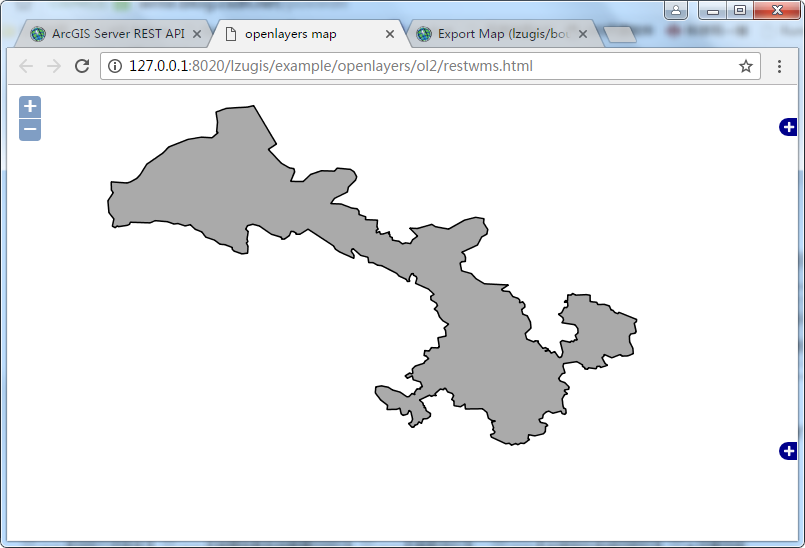
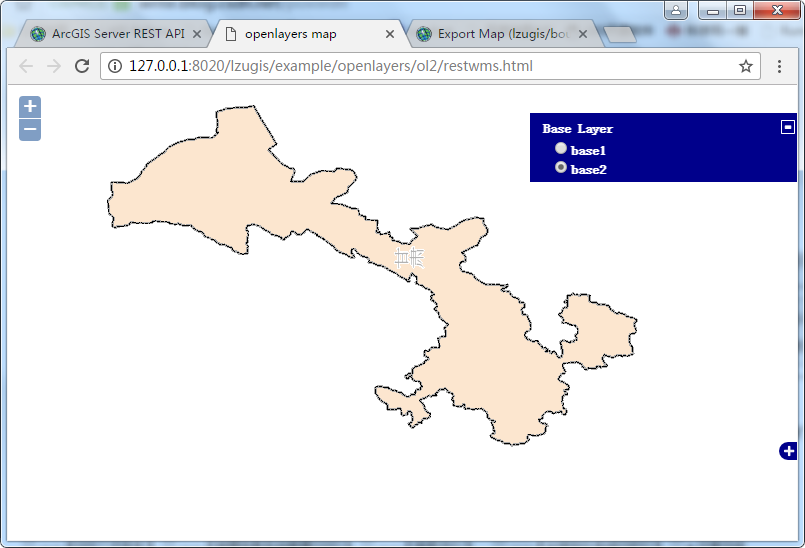
</html>实现后效果:
传播GIS知识 | 交流GIS经验 | 分享GIS价值 | 专注GIS发展
技术博客
http://blog.csdn.NET/gisshixisheng
在线教程
http://edu.csdn.Net/course/detail/799
Github
https://github.com/lzugis/
联系方式
q q:1004740957
e-mail:niujp08@qq.com
公众号:lzugis15
Q Q 群:452117357(webgis)
337469080(Android)

转载自:https://blog.csdn.net/GISShiXiSheng/article/details/52971329


