mapboxgl+geoserver开发矢量地图
mapboxgl可以调用mapbox公司自己的地图,那么如果我们需要发布自己的矢量瓦片,有几种方法
1.使用商业GIS软件,如国产的超图支持MVT发布
2.使用开源的GIS服务软件,比如geoserver
实现方法:
geoserver的新版本,2.14.1已经集成了mbtiles,老版本需要下载plugin才行
在geoserver中发布矢量地图,创建自己的layergroup,在图层组的设置页面,点Tile caching 标签

在Tile Image Formats中勾选 application/x-protobuf;type=mapbox-vector
以上在geoserver中发布mbtiles完成
以下是调用的方法
需要掌握mapboxgl中 sprite(字体库)、glyphs的概念
需要掌握mapboxgl中styles的设置
代码
<!DOCTYPE html>
<html>
<head>
    <meta charset="UTF-8">
    <title>矢量瓦片</title>
    <meta http-equiv="X-UA-Compatible" content="IE=Edge">
    <meta name="viewport" content="initial-scale=1.0, user-scalable=no, width=device-width">
    <style>
        html, body {
            margin: 0;
            padding: 0;
            height: 100%;
            width: 100%;
            position: relative;
        }


    </style>


    <script src='../../libs/mapbox-gl-js/mapbox-gl.js'></script>
    <link href='../../libs/mapbox-gl-js/mapbox-gl.css' rel='stylesheet' />
    <script src='../js/jquery.min.js'></script>
</head>

    <body style=" margin: 0;overflow: hidden;background: #fff;width: 100%;height:100%;position: absolute;top: 0;">
        <div id="map" style="margin:0 auto;width: 100%;height: 100%"></div>
        <script>

            var map, threeLayer, position = [104.07898, 30.66147];

            mapboxgl.accessToken = 'pk.eyJ1IjoiYWhvY2V2YXIiLCJhIjoiRk1kMWZaSSJ9.E5BkluenyWQMsBLsuByrmg';


            var simple = {
                "version": 8,
                "sprite":"http://" + window.location.host +"/examples/data/mbstyle/ArcTilerWeb/sprites/sprite",
                "glyphs": "http://" + window.location.host + "/examples/data/mbstyle/ArcTilerWeb/fonts/{fontstack}/{range}.pbf",
                "sources": {
                    "composite": {
                        "url": "mapbox://mapbox.mapbox-terrain-v2",
                        "type": "vector"
                    },
                    "esri": {
                        "type": "vector",
                        "scheme": "tms",
                        "tiles": [
                            "http://localhost:8080/geoserver/gwc/service/tms/1.0.0/KylinWS:TestSC@EPSG:900913@pbf/{z}/{x}/{y}.pbf"
                        ]
                    },
                },
                "layers":
                     [
        {
            "id": "cityregion",
            "type": "fill",
            "source": "esri",
            "source-layer": "cityregion",
            "layout": {},
            "paint": {
                "fill-color": "#D4CDBC"
            }
        },
        {
            "id": "ShuiXiPolygon",
            "type": "fill",
            "source": "esri",
            "source-layer": "ShuiXiPolygon",
            "layout": {},
            "paint": {
                "fill-color": "#73B2FF"
            }
        },
        {
            "id": "XianDao/1",
            "type": "line",
            "source": "esri",
            "source-layer": "XianDao",
            "minzoom": 8.58,
            "layout": {
                "line-cap": "round",
                "line-join": "round"
            },
            "paint": {
                "line-color": "#B9B7B9",
                "line-width": 4.13333
            }
        },
        {
            "id": "XianDao/0",
            "type": "line",
            "source": "esri",
            "source-layer": "XianDao",
            "minzoom": 8.58,
            "layout": {
                "line-cap": "round",
                "line-join": "round"
            },
            "paint": {
                "line-color": "#FFFFFF",
                "line-width": 2.13333
            }
        },
        {
            "id": "ShengDao/1",
            "type": "line",
            "source": "esri",
            "source-layer": "ShengDao",
            "layout": {
                "line-cap": "round",
                "line-join": "round"
            },
            "paint": {
                "line-color": "#D4C9B4",
                "line-width": 4.66667
            }
        },
        {
            "id": "ShengDao/0",
            "type": "line",
            "source": "esri",
            "source-layer": "ShengDao",
            "layout": {
                "line-cap": "round",
                "line-join": "round"
            },
            "paint": {
                "line-color": "#FFF9CC",
                "line-width": 2.66667
            }
        },
        {
            "id": "GuoDao/1",
            "type": "line",
            "source": "esri",
            "source-layer": "GuoDao",
            "layout": {
                "line-cap": "round",
                "line-join": "round"
            },
            "paint": {
                "line-color": "#E68C65",
                "line-width": 5.06667
            }
        },
        {
            "id": "GuoDao/0",
            "type": "line",
            "source": "esri",
            "source-layer": "GuoDao",
            "layout": {
                "line-cap": "round",
                "line-join": "round"
            },
            "paint": {
                "line-color": "#FFE6CF",
                "line-width": 3.06667
            }
        },
        {
            "id": "gaosu/1",
            "type": "line",
            "source": "esri",
            "source-layer": "gaosu",
            "layout": {
                "line-cap": "round",
                "line-join": "round"
            },
            "paint": {
                "line-color": "#B35933",
                "line-width": 5.6
            }
        },
        {
            "id": "gaosu/0",
            "type": "line",
            "source": "esri",
            "source-layer": "gaosu",
            "layout": {
                "line-cap": "round",
                "line-join": "round"
            },
            "paint": {
                "line-color": "#E69973",
                "line-width": 4
            }
        },
        {
            "id": "TieLu/1",
            "type": "line",
            "source": "esri",
            "source-layer": "TieLu",
            "layout": {
                "line-join": "round"
            },
            "paint": {
                "line-color": "#BFB8AA",
                "line-width": 1.88973
            }
        },
        {
            "id": "TieLu/0",
            "type": "line",
            "source": "esri",
            "source-layer": "TieLu",
            "layout": {
                "line-join": "round"
            },
            "paint": {
                "line-color": "#E6E6E6",
                "line-width": 0.755867,
                "line-dasharray": [
                    10.5839,
                    12.3479
                ]
            }
        },
        {
            "id": "GuoDao/label/Class 1",
            "type": "symbol",
            "source": "esri",
            "source-layer": "GuoDao",
            "minzoom": 9.87,
            "layout": {
                "symbol-placement": "line",
                "text-font": [
                    "Microsoft YaHei Regular"
                ],
                "text-size": 13.3333,
                "text-max-width": 8,
                "text-field": "{PathName}",
                "text-optional": true
            },
            "paint": {
                "text-color": "#000000"
            }
        },
        {
            "id": "gaosu/label/Class 1",
            "type": "symbol",
            "source": "esri",
            "source-layer": "gaosu",
            "layout": {
                "symbol-placement": "line",
                "text-font": [
                    "Microsoft YaHei Regular"
                ],
                "text-size": 13.3333,
                "text-max-width": 8,
                "text-field": "{PathName}",
                "text-optional": true
            },
            "paint": {
                "text-color": "#000000"
            }
        },
        {
            "id": "citypoint",
            "type": "symbol",
            "source": "esri",
            "source-layer": "citypoint",
            "layout": {
                "icon-image": "citypoint",
                "icon-allow-overlap": true,
                "text-font": [
                    "Microsoft YaHei Regular"
                ],
                "text-size": 13.3333,
                "text-anchor": "bottom",
                "text-max-width": 8,
                "text-field": "{Name}",
                "text-optional": true
            },
            "paint": {
                "text-color": "#000000",
                "text-halo-color": "#E1E1E1",
                "text-halo-width": 1.33333
            }
        },
        {
            "id": "XianPoint",
            "type": "symbol",
            "source": "esri",
            "source-layer": "XianPoint",
            "minzoom": 7.94,
            "layout": {
                "icon-image": "XianPoint",
                "icon-allow-overlap": true,
                "text-font": [
                    "Microsoft YaHei Regular"
                ],
                "text-size": 13.3333,
                "text-anchor": "center",
                "text-max-width": 8,
                "text-field": "{Name}",
                "text-optional": true
            },
            "paint": {
                "text-color": "#000000"
            }
        },
        {
            "id": "XianZhen",
            "type": "symbol",
            "source": "esri",
            "source-layer": "XianZhen",
            "minzoom": 9.98,
            "layout": {
                "icon-image": "XianZhen",
                "icon-allow-overlap": true,
                "text-font": [
                    "Microsoft YaHei Regular"
                ],
                "text-size": 13.3333,
                "text-anchor": "bottom",
                "text-max-width": 8,
                "text-field": "{Name}",
                "text-optional": true
            },
            "paint": {
                "text-color": "#000000"
            }
        }
                     ]


            }

            var map = new mapboxgl.Map({
                container: 'map',
                style: simple,
                zoom: 8,
                center: [104.07898, 30.66147]
            });

            map.addControl(new mapboxgl.NavigationControl(), 'top-left');

        </script>
    </body>
</html>
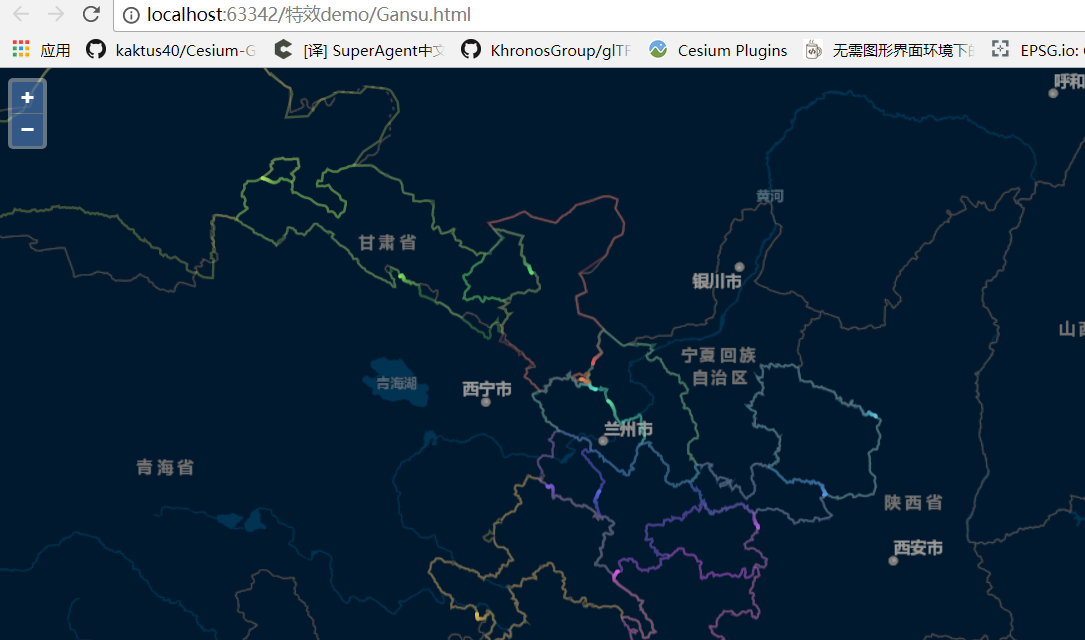
效果


转载自:https://blog.csdn.net/GIS_Lyn/article/details/84746523