
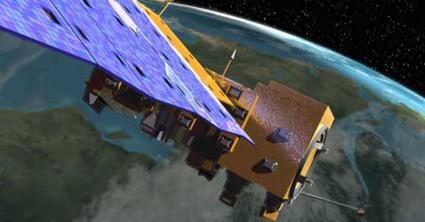
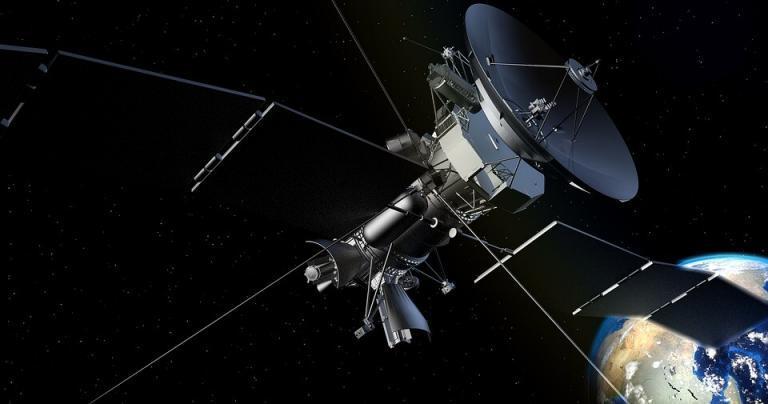
Despite popular belief that MODIS is a satellite, it’s actually an instrument onboard a satellite.
MODIS stands for Moderate Resolution Imaging Spectroradiometer. It has 36 spectral bands, 250-1000 meter resolution, and averages a 2-day revisit period.
Because of this versatility, MODIS has changed how we understand our land, ocean, and atmosphere. And due to its enormous coverage, it enables us to monitor activities such as active fires, land use change, and volcanic activity.
Let’s dive right in and explore MODIS bands, resolution, and temporal frequency.
MODIS Uses and Applications
Since its launch, MODIS had been referred to as the quintessential instrument of Earth Observation. This is because it covers more ground, and captures more spectral bands with higher temporal frequency.
For example, it collects essential data about land, ocean, and atmosphere about every 2 days. In these 3 examples below, we just barely scratch the surface of the applications and uses of MODIS imagery.
Fire and Hot Spot Detection
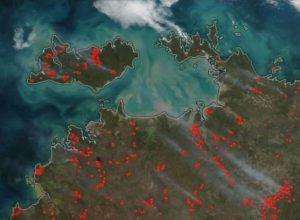
The fire detection algorithm uses MODIS to detect active fires. Comparing temperature to neighboring pixels determines the severity and extent of the fire. If the difference is over a given threshold, it confirms the “hot spot” as an active wildfire. But if the fire is too small to detect due to the spatial resolution of the sensor, the satellite cannot detect it.
Land Cover
The MODIS instrument tracks land use change by examining its spectral properties over the land. For example, the 500-meter MODIS Land Cover Maps (17 land cover classes) describe the dominant class based on a 10-year span (2001-2010). Additionally, there is a 23-class ESA global land cover product available at 1km resolution.
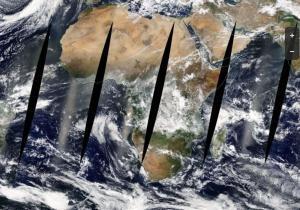
Cloud Properties
Clouds are fundamentally important in weather and climate. Before MODIS, it was common to believe that clouds covered about 50% of Earth at any given time. But after examining MODIS imagery, it showed that cloud cover was closer to 70%. Also, MODIS accounts for the temperature and height of clouds as well as the composition of ice or water.
READ MORE: 100 Earth Shattering Remote Sensing Applications & Uses
MODIS Imagery and Resolution
Spectral Resolution
MODIS is one of the most versatile sensors with its 36-channel imaging spectrometer. For the first 20 bands, it captures reflected solar radiation. From these bands, we can better understand the physical properties of the environment. For example, we use its 16 thermal bands to measure surface and ocean temperature.
Spatial Resolution
MODIS has a pixel resolution of 250m, 500m to 1 km. Starting with its finest spatial resolution, it can make out features about the size of 3 football fields. But its most important asset is its enormous swath covering a width of 2,330 km at 12-bit radiometric sensitivity.
Temporal Resolution
On board NASA’s flagship satellites Terra and Aqua (A-Train), MODIS has a 2-day repeat coverage of the entire planet. Depending on cloud coverage, its temporal frequency makes this sensor a perfect candidate for monitoring any activity on land. MODIS sensors only capture data on the dayside portion because it measures reflected light from the sun. In a polar orbit, the Aqua satellite circles the Earth every 99 minutes.
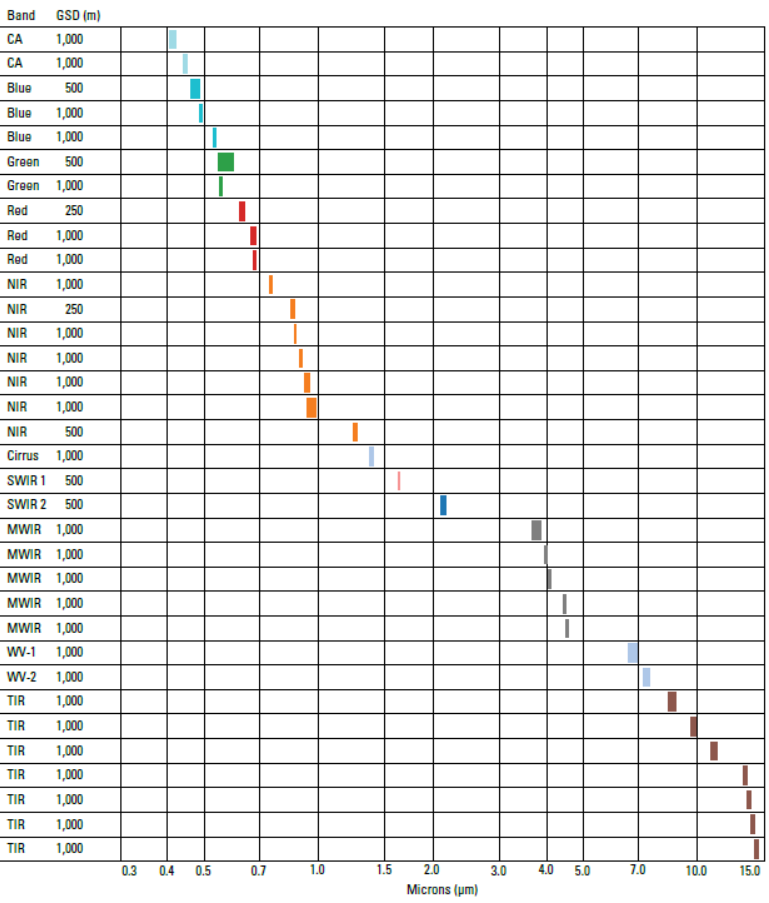
Reflective Bands
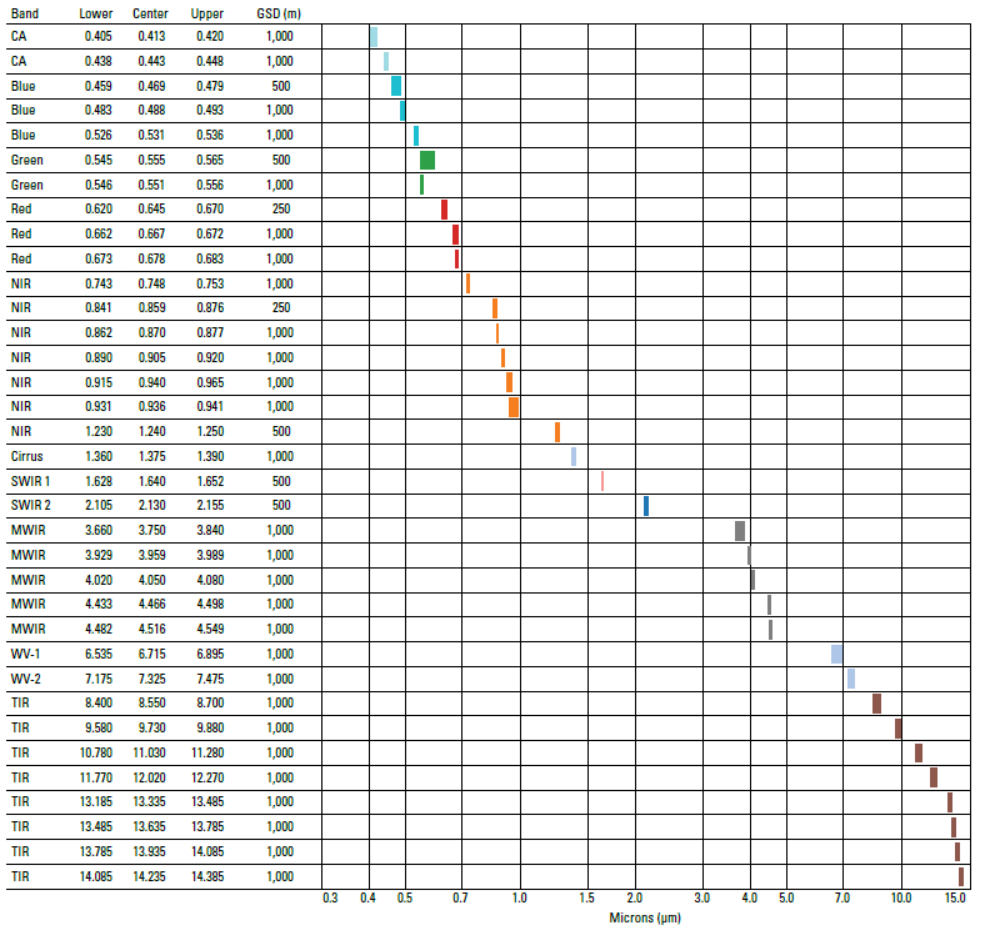
Here is a list of all bands for the MODIS sensor including ground sampling distance and spectral bands.
| Band | Bandwidth (µm) | Resolution (m) |
| 1 | 0.620-0.670 | 250 |
| 2 | 0.841-0.876 | 250 |
| 3 | 0.459-0.479 | 500 |
| 4 | 0.545-0.565 | 500 |
| 5 | 1.230-1.250 | 500 |
| 6 | 1.628-1.652 | 500 |
| 7 | 2.105-2.155 | 500 |
| 8 | 0.405-0.420 | 1000 |
| 9 | 0.438-0.448 | 1000 |
| 10 | 0.483-0.493 | 1000 |
| 11 | 0.526-0.536 | 1000 |
| 12 | 0.546-0.556 | 1000 |
| 13 | 0.662-0.672 | 1000 |
| 14 | 0.673-0.683 | 1000 |
| 15 | 0.743-0.753 | 1000 |
| 16 | 0.862-0.877 | 1000 |
| 17 | 0.890-0.920 | 1000 |
| 18 | 0.931-0.941 | 1000 |
| 19 | 0.915-0.965 | 1000 |
Thermal Bands
| Band | Bandwidth (µm) | Resolution (m) |
| 20 | 3.660-3.840 | 1000 |
| 21 | 3.929-3.989 | 1000 |
| 22 | 3.929-3.989 | 1000 |
| 23 | 4.020-4.080 | 1000 |
| 24 | 4.433-4.498 | 1000 |
| 25 | 4.482-4.549 | 1000 |
| 26 | 1.360-1.390 | 1000 |
| 27 | 6.538-6.895 | 1000 |
| 28 | 7.175-7.475 | 1000 |
| 29 | 8.400-8.700 | 1000 |
| 30 | 9.580-9.880 | 1000 |
| 31 | 10.780-11.280 | 1000 |
| 32 | 11.770-12.270 | 1000 |
| 33 | 13.185-13.485 | 1000 |
| 34 | 13.485-13.758 | 1000 |
| 35 | 13.785-14.085 | 1000 |
| 36 | 14.085-14.385 | 1000 |
Conclusion
Today you’ve learned that MODIS is an instrument on board both the Terra and Aqua satellites. Over time, it has become pivotal in improving our understanding of our land, ocean, and atmosphere.
For example, it gives us a peek inside the ocean and broadens our understanding of its biology and food cycle.
In the atmosphere, it helps us get the whole picture of cloud properties and what percent they cover Earth. Lastly, it assists us in monitoring active wildfires, land-use change, and volcanic activity.
Can you think of any other applications on how scientists are using the MODIS instrument? Please let us know with a comment below.


