Explore the Visible (and Invisible) with Spectral Bands
Last month, I started building a secret list, in my top-secret laboratory, of spectral bands and their spectral signatures. I asked the world’s wisest to contribute their wisdom.
The result?
One of the best spectral signature cheatsheets that exist today.
Today, we explore the visible – and invisible. Whether it’s near-infrared or the cirrus band, use this clear and concise guide to remote sensing spectral signatures to extract as much data as possible from your imagery.
What is a Spectral Band, Anyhow?
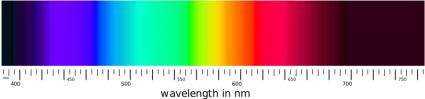
Thanks to our atmosphere, we only see specific portions of the electromagnetic (EM) spectrum.
The graph below shows our “atmospheric window”. The EM energy (in blue) is what we are capable of seeing on Earth.
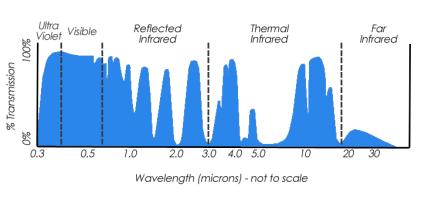
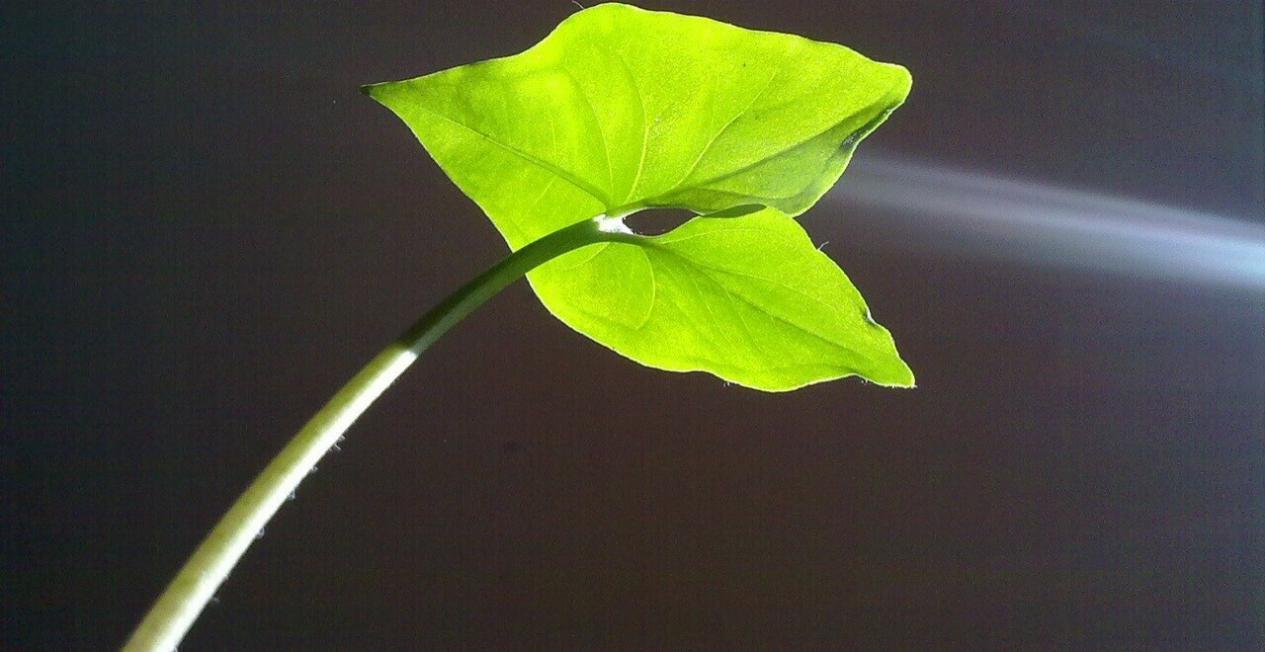
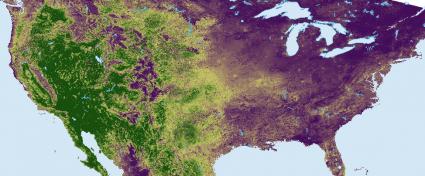
Our eyes can only see the visible portion – red, green, and blue. Healthy vegetation (or chlorophyll) reflects more green light compared to other wavelengths. It absorbs more red and blue light. That is why our eyes see it as green.
But special types of sensors can pick up other forms of the EM spectrum – invisible to the human eye. For example, vegetation also reflects, even more, near-infrared (NIR). Near-infrared is invisible to the human eye, but sensors can pick up this spectral band.
…So special types of sensors can reveal new insights about Earth’s features, that our eyes can’t.
About that Top Secret Laboratory…
Getting back to the whole spectral signature top-secret laboratory… My confession is that it’s actually the USGS spectral signature laboratory. We don’t have a spectral band laboratory at GISGeography.com 🙁
…But the USGS has one… and a handy Spectral Characteristics Viewer. And they’ve vigorously tested the spectral reflectance of hundreds of materials in the lab. All this data has been compiled on their spectral library website.
The takeaway is this:
Every object has its own chemical composition. This is the equivalent of saying that each composition has its own spectral signature.
Take the mining industry, there are over 4000 natural minerals on Earth. Each one has its own chemical composition that makes it different from one another. When you have more spectral bands, this gives greater potential to map more minerals, vegetation, or anything!
OK, what’s your point?
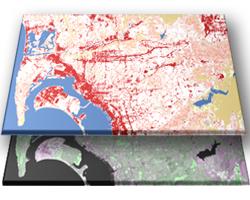
You can pick and choose which spectral bands to use in your image classification techniques in remote sensing.
This means in your remote sensing classification you will have a higher probability of auto-magically pulling out features of interest with spectral signatures.
…which brings us to our next section – the spectral signature cheatsheet.
The Spectral Signature Cheatsheet
A spectral signature plots all the variations of reflected EM radiation as a function of wavelengths.
Pick and choose the spectral bands you use in your classification.
If you want to pull out vegetation from a multispectral image, this spectral signature clearly shows you should leverage the near-infrared band (0.76-0.9µm).
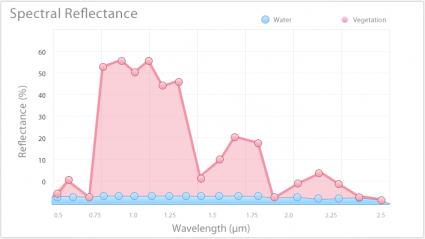
…and Normalized Difference Vegetation Index (NDVI) might be just one of the best ways to normalize your data.
Nothing is written in stone for image classification.
These are just general guidelines to help you with classification.
Without further ado…
1. Coastal Aerosol (0.43-0.45µm)
As the name implies, your coastal aerosol band is particularly useful in coastal, bathymetric, and aerosol studies. The coastal band reflects blues and violets and is becoming more common on satellite sensors such as Landsat-8 and WorldView-3. Here are some of its spectral band applications:

WHALE POPULATION: Because of its ability to penetrate water (up to 20-30m in clear water), the coastal band can estimate (sub-surface) whale populations. This spectral band allows more confidence in the identification of whales in the wild as opposed to observations of animals in captive tanks. (Counting whale populations from space)
BATHYMETRY: Because the coastal aerosol band is absorbed less by water, it allows for coastal water and ocean color observation. This is also useful for spectral signatures for marine vegetation like seagrass and other underwater benthic habitats.
AEROSOLS: Because the coastal aerosol band is more sensitive to clouds, smoke, and haze, it’s being used for filtering out clouds in imagery processing. Earth observers are fine-tuning cloudless orthoimagery as base maps with the help of the coastal aerosol band. (Cloud detection and removal techniques in Landsat 8 imagery)
2. Blue (0.45-0.51µm)
Snorkel in an oasis of marine vegetation with the deepwater imaging of the blue band. Your eyes can see reflected blue light. Depending on the clarity of the water, visible light like the blue band can reach depths up to 20-30 meters. Tweak your spectral signature using the blue band for deepwater imaging.
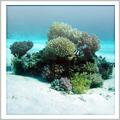
DEEP WATER IMAGING: Because of its finer level of spectral penetration in coastal areas, underwater reefs, water turbidity and sediment, submerged aquatic vegetation, turbidity, and bathymetric mapping make for some unique remote sensing applications.
SMOKE PLUMES, ATMOSPHERIC HAZE, AND CLOUDS: The visible range blue is shorter wavelengths like blue (0.45-0.51µm), which are most sensitive to atmospheric haze. This makes the blue band ideal for detecting smoke plumes because shorter wavelengths are more easily scattered by smaller particles.
CLOUDS, SNOW AND ROCK: Separating clouds from snow and rock because the spectral signature of haze and thin clouds is highly sensitive to both blue and red wavelengths. (Cloud and Snow Discrimination)
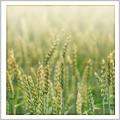
3. Green (0.53-0.59µm)
To many, green signifies nature – plants, trees, and forests. It’s the same in remote sensing. The green portion covers the reflectance peak from leaf surfaces (hence the color green that we see). This also means the spectral reflectance is low in the blue and red regions of the spectrum because of the absorption by chlorophyll during photosynthesis.
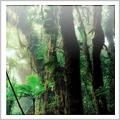
PLANT VIGOR AND VEGETATION: Green can discriminate between broad vegetation classes and discriminating plant material.
ALGAL AND CYANOBACTERIAL BLOOMS: Clean and clear water generally reflects little in any part of the spectrum. However, the reflectance is maximum at the blue end of the spectrum – hence the color blue our eyes see. But when algal blooms are present, green is where the maximum reflectance generally occurs.
URBAN RECREATION: The grassy and forested greens in urban areas are indicated as recreational areas like parks, golf courses, and cemeteries.
4. Red (0.64-0.67µm)
Tropical soils, the built environment, and geological features generally have red contribute to its spectral signature. Red is used in formulas like the Normalized Difference Vegetation Index (NDVI) because of how much plants absorb red (and blue) light.
SOIL TYPES AND GEOLOGIC FEATURES: The reflectance of bare soil generally depends on its composition. The soils in Australia almost mimic Mars because of their redness. Soils rich in iron-oxide with its rust color have a high reflectance in the red spectral band – great for this type of soil spectral signature. (Predicting soil properties)
BUILT AND NATURAL ENVIRONMENT: The red band has been used for discriminating between man-made objects and vegetation. A spectral signature for cultural features such as roads and human settlements is best detected in the red band.
CHLOROPHYLL ABSORPTION: One-half of the variables used in NDVI – healthy vegetation reflects more near-infrared (NIR) and green light compared to other wavelengths. It absorbs more red and blue light and is used to quantify vegetation in NDVI.
5. Yellow (0.585-0.625µm)
The “yellow” band is relatively new and can be found as early as Worldview-2. This band collects a bit finer detail from the 0.585-0.625 µm portion of the spectrum. Simply, it collects the “yellowness” of a particular object.
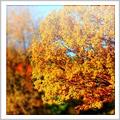
INSECT DISEASE IN TREE CROWNS: One study developed a yellowness index (YI) as a measure for chlorosis of leaves in stressed plants and manganese-deficient soybean leaves. (Estimating stressed vegetation with the Yellowness Index)
FEATURE CLASSIFICATION: The yellow band can be useful in different seasons to delineate invasive grass and other general features. It’s also been used to classify individual tree species and crop types by season.
6. Red-Edge (0.705-0.745µm)
The red-edge band is between the near-infrared and red bands. For chlorophyll, the red portion strongly absorbs light while the near-infrared generates a strong reflection. In the transition between these two spectral bands is the red-edge band.
PLANT HEALTH AND AGE STATUS: With a high reflectivity of plant health and vitality, the vegetation response from the red-edge is often greatest for both the chlorophyll content and the leaf structure – such as leaf area index (LAI). (Identifying plant stress using red-edge)
CROP MONITORING: Applying the red-edge band to precision farming and even discriminating between healthy and crops impacted by the spread of disease. Plus, we can use it to distinguish between crop types and nutrition.
7. Near Infrared 1 – NIR-1 (0.76-0.90µm)
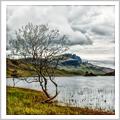
Near-infrared reflectance is one of the most powerful ways to classify healthy vegetation. Separating classes like water and vegetation is always easier in the near-infrared region. This is because, healthy plants reflect more energy in the near-infrared spectrum, while water absorbs it.

BIOMASS CONTENT: The internal structure of healthy chlorophyll uncannily reflects near-infrared radiation. But when plants wilt and eventually die, the near-infrared response lessens until nothing is left.
ARCHAEOLOGICAL SITES: Unearthing ancient archaeological sites by interpreting denser mud bricks, crop marks, and subtle differences in vegetation, soil, and geology from near-infrared radiation. (Near-infrared aerial crop mark archaeology)
NORMALIZED DIFFERENCE VEGETATION INDEX (NDVI): Scientists use near-infrared in the spectral signature for measuring plant health. For instance, we use the NDVI ratio that consists of near-infrared and red bands. NDVI extracts vegetation differences more precisely than if we only looked at visible greenness.
8. Near Infrared 2 – NIR-2 (0.86-1.04µm)
There is a significant overlap between the near-infrared 2 and near-infrared-1 bands. The main difference between the two bands is that the near-infrared-2 band is affected less by atmospheric influence.
VEGETATION STUDIES: Near infrared-2 delivers more sophisticated vegetation analysis and biomass studies primarily because it’s less impacted by the atmosphere. (Reflectance of visible and near-infrared radiation from vegetation)
LAND/WATER BOUNDARIES: Water is a strong absorber of near-infrared light, while vegetation is a strong reflector. You can delineate forest fragmentation and quantitatively the loss and gain of forests around the world with near-infrared.
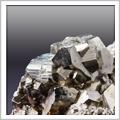
9. Short-wave Infrared 1 – SWIR-1 (1.57-1.65µm)
Short-wave infrared (SWIR) can help discriminate between dry and wet soils. Not only can it help classify in disciplines like geology and soil classification, but it can better penetrate thin clouds, smoke and haze better than visible bands.
MOISTURE CONTENT: SWIR-1 is sensitive to the moisture content in soil and vegetation. Reflectance decreases as water content increases. This makes it useful for distinguishing wet earth from dry earth.
CLOUD/SMOKE PENETRATION SWIR sees through smoke in the atmosphere to the terrain underneath. This helps direct response crews and fight forest fires more effectively.
MINERAL EXPLORATION – Studies have shown obtaining spectral signatures for indicator minerals like carbonates, ammonium, sulfates, and ferric iron or hematite in rocks is easier with SWIR. (Mapping rocks and minerals with ASTER SWIR band)
10. Short-wave Infrared 2 – SWIR-2 (2.08-2.35µm)
Short-wave infrared-2 has similarities to SWIR-1. SWIR-2 assists in imaging soil types, geological features, and minerals such as copper and sulfates. It’s also sensitive to vegetation and soil moisture variations. Snow and ice feature and clouds appear darker toned.

WATER PROPERTIES: Water has much stronger absorption using SWIR. This helps spectral signature responses for monitoring blue-green algae bloom and turbid waters.
IRRIGATION PRACTICES: The reflectance of short-wave infrared is affected by the leaf water content, making it ideal to understand crop water stress and targeting irrigation. (Estimating crop water stress and drought with SWIR)
MINERAL MAPPING: SWIR covers a range where clay types of minerals deliver a greater spectral signature. Hydrous minerals appear darker to discriminate between different types of kaolinite and smectite.
11. Panchromatic (0.50-0.68µm)
Just like black and white film, panchromatic bands collect all visible reflected light at once into a single channel. Because it sees more light at once, the spatial resolution is sharpest in contrast to collecting the red, blue, and green channels separately. For example, Landsat-8’s panchromatic band is 15-meter grid cells. The other spectral bands are 30-meter resolution except for the thermal band. The only drawback with the pan-band is that you won’t be able to differentiate colors.

PANSHARPENING: Sharpen your images with pansharpening by combining color information with the panchromatic band. Because panchromatic bands sacrifice spectral resolution for spatial resolution, it delivers sharper image definition with pansharpening.
12. Cirrus (1.36 -1.38µm)
The cirrus band earned its name because it’s a specialist in cirrus cloud detection. The atmosphere absorbs almost all of the cirrus band, as the ground is barely visible. This band can detect high-altitude clouds which you can’t pick out with other bands.

CIRRUS CLOUDS: Cirrus clouds reflect brightly while most land surfaces will appear dark. Improved detection of the pesky cirrus cloud helps with removal and enhancements in imagery base maps.
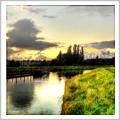
13. Thermal Infrared – TIRS-1 (10.60–12.51µm)
The thermal infrared band sees heat. Landsat’s thermal infrared uses emitted instead of reflected radiation. It has a coarser resolution of 100 meters but is still useful in understanding surface temperature, night studies, and even volcano monitoring.
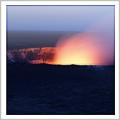
VOLCANO ACTIVITY: Despite its coarser spatial resolution, thermal infrared can estimate lava discharge rates from volcanoes. Night-time thermal infrared images give energy flux estimations for volcano hazard identification. (Volcano activity using thermal infrared in New Zealand)
URBAN HEAT: TIRS gives insight into where surface temperature heat is within a city. Parks, open water, and natural vegetation are generally coolest while industrial neighborhoods are warmest. It’s often the case that a city or metropolitan area is significantly warmer than its surrounding rural areas due to human activities. (Urban heat islands and land surface temperature)
WEATHER PREDICTION: NOAA Geostationary Operational Environmental Satellite (GOES) collects thermal infrared to understand cloud heights and types – and even ocean surface features.
What’s Next?
See for yourself.
Not our Earth, but Chromoscope lets you explore our Galaxy (the Milky Way) and the distant Universe in a range of wavelengths from gamma-rays to the longest radio waves.
Or check out some of our other remote sensing tutorials: