【转】Leaflet开发
目录
2016年10月9日
2016年10月11日添加统计图
2016年10月17日添加Identify
1 目标:实现HTML展示地图的功能。
在WEB页面展示在线的地图服务,并实现常用的地图操作,完成各种地图交互,显示各种地图数据等功能。
2原理:JS+CSS实现各种地图服务、资源的展示和控制。
通过JS+CSS按照各种地图服务标准,获取地图数据,通过HTML展示、控制、交互等。
Leaflet核心包实现了标准地图服务、资源的展示和控制,其它地图服务需要使用插件实现,如arcgis地图服务需要使用arcgis的插件才能加载,google地图服务不对外开放,需要使用google map的api 插件才能加载。
Leaflet主要组件是map,使用一个div作为地图的容器,在其中展示地图。Leaflet使用L对象作为所有Leaflet的基本对象。
参考:http://leafletjs.com/reference-1.0.0.html#map-example
http://leafletjs.com/examples.html
3方法:Leaflet基本类型
参考:http://leafletjs.com/examples/quick-start/
http://leafletjs.com/reference-1.0.0.html
3.1 地图Map:L.map
初始化:L.map(“div id”)。
3.2 图层:tileLayer,tileLayer.wms等多种类型的图层。
3.2.1 TMS:tileLayer
L.tileLayer(‘http://{s}.tile.osm.org/{z}/{x}/{y}.png’,{
attribution: ‘© <ahref=”http://osm.org/copyright”>OpenStreetMap</a>contributors’
}).addTo(map);
3.2.2 WMS:tileLayer.wms
varwmsBhxq = L.tileLayer.wms(‘http://localhost:8087/geoserver/bhxq/wms?’, {
layers: ‘bhxq:bhxq’,
format: ‘image/png’,
transparent: true,
attribution: “Map© 2016 XXZX”
}).addTo(mymap);
varmymap = L.map(‘mapid’).setView([38.88, 117.58], 10);
varwmsTDHBaseMap =L.tileLayer.wms(‘http://111.160.249.157:8095/Tile/WMS/BHGGVECTORBLEND.gis’, {
layers: ‘bhggvectorblend’,
crs:L.CRS.EPSG4326,
format: ‘image/png’,
transparent: true,
attribution: “Map© 2016 XXZX”
}).addTo(mymap);
3.2.2.1 标准的WMS不支持GetFeatureInfo(),可以通过插件实现元素信息查询功能。
插件地址:https://github.com/heigeo/leaflet.wms
原理:添加identify启用功能(默认启用),通过GetFeatureInfo()提交ajax请求数据,parseFeatureInfo()处理返回值,ShowFeatureInfo()将结果显示在Map上。
示例:参见:Identify地图元素信息:点击地图显示图层对应元素的信息
3.2.3 WMTS:不能直接加载,需要使用插件L.tileLayer.WMTS加载。
3.3 地图元素:Marker,Popup,Tooltip
3.3.1 图标Marker:L.marker(坐标).addTo(地图)。
Div作为Marker的图标:L.divIcon()。
varmyDivIcon=L.divIcon({
className:’leaflet-echart-icon’,
iconSize:[160, 160],
html:'<div id=”marker1″ style=”width: 160px; height: 160px;position: relative; background-color: transparent;”>asd</div>’
});
varmarker=L.marker([51.5, -0.09],{icon:myDivIcon}).addTo(map);
3.3.2 气泡Popup:marker.bindPopup(‘pop <br>OK.’).openPopup();
3.4 地图控件:zoom,layers等固定的不随map移动上的HTML元素。
L.control.layers(null,baseLayers).addTo(mymap);
添加控件:L.control(),指定位置postion,指定内容onAdd。
varchartControl=L.control({position:’bottomright’});
chartControl.onAdd=function(map){
vardiv=L.DomUtil.create(‘div’,’info div’);
div.id=”chartdiv”;
div.style=”width:500px;height: 300px; background-color: white;”;
returndiv;
};
chartControl.addTo(map);
自定义控件:
3.5 事件event:事件的响应函数可以获取事件参数。
mymap.on(‘click’, onMapClick);
4应用
注意:div style中width,height 100%无效的问题,添加html,body的style解决。
html, body{ margin:0;height:100%; }
参考:http://www.weste.net/2014/4-28/96579.html
http://www.cnblogs.com/shitao/p/5604652.html
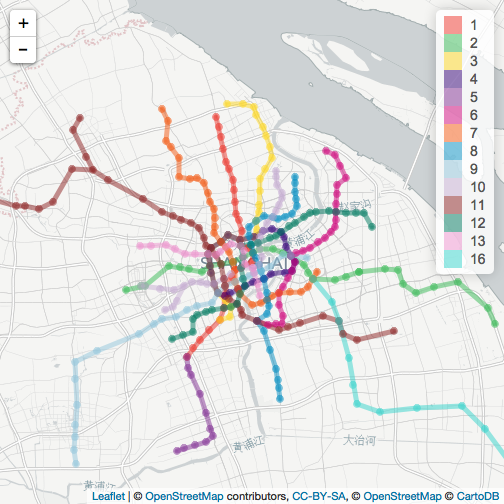
4.1 基本展示
参考:http://leafletjs.com/examples/quick-start/
//index.htm
<!DOCTYPE html>
<html>
<head>
<metacharset=”utf-8″ />
<linkrel=”stylesheet” href=”js/leaflet/leaflet.css” />
<styletype=”text/css”>
html, body{ margin:0;height:100%; }
#map{ height:100%;width:100%;}
</style>
<scripttype=”text/javascript” src=”js/leaflet/leaflet-src.js”></script>
<title>LeafletDemo</title>
</head>
<body>
<divid=’map’></div>
<scripttype=”text/javascript”>
varmap=L.map(‘map’).setView([51.505, -0.09], 13);
L.tileLayer(‘http://{s}.tile.osm.org/{z}/{x}/{y}.png’,{
attribution: ‘© <ahref=”http://osm.org/copyright”>OpenStreetMap</a>contributors’
}).addTo(map);
L.marker([51.5,-0.09]).addTo(map).bindPopup(‘A pretty CSS3 popup.<br> Easilycustomizable.’).openPopup();
</script>
</body>
</html>
4.2 图层控制
//bhxq.htm
<!DOCTYPE html>
<html>
<head>
<metacharset=”UTF-8″>
<linkrel=”stylesheet” href=”js/leaflet/leaflet.css” />
<style>
html, body{margin:0; height:100%; }
#mapid {height:100%;width: 100%;}
</style>
<scripttype=”text/javascript” src=”js/leaflet/leaflet-src.js”></script>
<title>滨海新区</title>
</head>
<body>
<divid=”mapid”></div>
<scripttype=”text/javascript”>
var mymap =L.map(‘mapid’).setView([38.88, 117.58], 10);
var wmsBhxq =L.tileLayer.wms(‘http://localhost:8087/geoserver/bhxq/wms?’, {
layers: ‘bhxq:bhxq’,
format: ‘image/png’,
transparent: true,
attribution: “Map© 2016 XXZX”
}).addTo(mymap);
var wmsRoad =L.tileLayer.wms(‘http://localhost:8087/geoserver/bhxq/wms?’, {
layers: ‘bhxq:主要道路’,
format:’image/png’,
transparent: true,
attribution: “Map© 2016 XXZX”
}).addTo(mymap);
var wmsPlace =L.tileLayer.wms(‘http://localhost:8087/geoserver/bhxq/wms?’, {
layers: ‘bhxq:行政地名’,
format:’image/png’,
transparent: true,
attribution: “Map© 2016 XXZX”
}).addTo(mymap);
var baseLayers ={
“滨海新区”:wmsBhxq,
“主要道路”:wmsRoad,
“行政地名”:wmsPlace
};
L.control.layers(null,baseLayers).addTo(mymap);
var popup =L.popup();
functiononMapClick(e) {
popup.setLatLng(e.latlng).setContent(“You clicked the map at “+ e.latlng.toString()).openOn(mymap);
}
mymap.on(‘click’,onMapClick);
</script>
</body>
</html>
4.3 地图+统计图:leaflet显示echarts图表
ECharts参见:..\Net\ECharts.docx
参考:http://www.cnblogs.com/shitao/p/5604652.html
4.3.1 地图点击气泡显示ECharts图表
目标:在leaflet地图点击气泡显示ECharts图表。
原理:leaflet地图的marker中显示ECharts图表的HTML。
//popup.htm
<!DOCTYPE html>
<html>
<head>
<metacharset=”utf-8″ />
<styletype=”text/css”>
html, body{margin:0; height:100%; }
#map {height:100%;width:100%;}
</style>
<linkrel=”stylesheet” href=”js/leaflet/leaflet.css” />
<script type=”text/javascript”src=”js/leaflet/leaflet-src.js” ></script>
<scripttype=”text/javascript” src=”js/echarts/echarts.js”></script>
<title>LeafletCharts Demo</title>
</head>
<body>
<divid=’map’></div>
<scripttype=”text/javascript”>
varmap=L.map(‘map’).setView([51.505, -0.09], 13);
L.tileLayer(‘http://{s}.tile.osm.org/{z}/{x}/{y}.png’,{
attribution: ‘© <ahref=”http://osm.org/copyright”>OpenStreetMap</a>contributors’
}).addTo(map);
varmarker=L.marker([51.5, -0.09]).addTo(map);
var content ='<div style=”width: 280px; height: 280px;”id=”marker2″></div>’;
marker.bindPopup(content,{});
marker.on(‘popupopen’,function(e) {
// 基于准备好的dom,初始化echarts实例
var myChart =echarts.init(document.getElementById(‘marker2’));
// 指定图表的配置项和数据
option = {
tooltip: {
trigger: ‘axis’
},
xAxis: [{
type: ‘category’,
data: [‘1月’, ‘2月’, ‘3月’, ‘4月’]
}],
yAxis: [{
type: ‘value’,
name: ‘水量(ml)’,
min: 0,
max: 50,
interval: 50,
axisLabel: {
formatter: ‘{value} ‘
}
}, {
type: ‘value’,
name: ‘温度(°C)’,
min: 0,
max: 10,
interval: 5,
axisLabel: {
formatter: ‘{value} ‘
}
}],
series: [{
name: ‘蒸发量’,
type: ‘bar’,
data: [2.0, 4.9, 7.0, 23.2]
}, {
name: ‘降水量’,
type: ‘bar’,
data: [2.6, 5.9, 9.0, 26.4]
}, {
name: ‘平均温度’,
type: ‘line’,
yAxisIndex: 1,
data: [2.0, 2.2, 3.3, 4.5]
}]
};
// 使用刚指定的配置项和数据显示图表。
myChart.setOption(option);
});
</script>
</body>
</html>
4.3.2 地图固定位置显示ECharts图表
目标:在leaflet地图固定位置显示ECharts图表。
原理:leaflet地图的控件,在此控件上显示chart的html。
//mapcharts_control.html
<!DOCTYPE html>
<html>
<head>
<metacharset=”utf-8″ />
<styletype=”text/css”>
html, body{margin:0; height:100%; }
#map {height:100%;width:100%;}
</style>
<linkrel=”stylesheet” href=”js/leaflet/leaflet.css” />
<scripttype=”text/javascript” src=”js/leaflet/leaflet-src.js”></script>
<scripttype=”text/javascript” src=”js/echarts/echarts.js”></script>
<title>LeafletMap Charts Control Demo</title>
</head>
<body>
<divid=’map’></div>
<scripttype=”text/javascript”>
varmap=L.map(‘map’).setView([51.505, -0.09], 13);
L.tileLayer(‘http://{s}.tile.osm.org/{z}/{x}/{y}.png’,{
attribution: ‘© <ahref=”http://osm.org/copyright”>OpenStreetMap</a>contributors’
}).addTo(map);
varmarker=L.marker([51.5, -0.09]).addTo(map);
var content = ‘<div style=”width: 280px; height:280px;” id=”marker2″></div>’;
marker.bindPopup(content,{});
marker.on(‘popupopen’,function(e) {
var myChart= createChart(‘marker2’);
});
//create controlchart
var chartControl=L.control({position:’bottomright’});
chartControl.onAdd=function(map){
vardiv=L.DomUtil.create(‘div’,’info div’);
div.id=”chartdiv”;
div.style=”width:500px;height: 300px; background-color: white;”;
returndiv;
};
chartControl.addTo(map);
createChart(‘chartdiv’);
//creat echarts
functioncreateChart(divid){
// 基于准备好的dom,初始化echarts实例
var myChart= echarts.init(document.getElementById(divid));
// 指定图表的配置项和数据
option = {
tooltip: {
trigger: ‘axis’
},
xAxis: [{
type: ‘category’,
data: [‘1月’, ‘2月’, ‘3月’, ‘4月’]
}],
yAxis: [{
type: ‘value’,
name: ‘水量(ml)’,
min: 0,
max: 50,
interval: 50,
axisLabel: {
formatter: ‘{value} ‘
}
}, {
type: ‘value’,
name: ‘温度(°C)’,
min: 0,
max: 10,
interval: 5,
axisLabel: {
formatter: ‘{value} ‘
}
}],
series: [{
name: ‘蒸发量’,
type: ‘bar’,
data: [2.0, 4.9, 7.0, 23.2]
}, {
name: ‘降水量’,
type: ‘bar’,
data: [2.6, 5.9, 9.0, 26.4]
}, {
name: ‘平均温度’,
type: ‘line’,
yAxisIndex: 1,
data: [2.0, 2.2, 3.3, 4.5]
}]
};
// 使用刚指定的配置项和数据显示图表。
myChart.setOption(option);
returnmyChart;
}
</script>
</body>
</html>
4.3.3 地图直接显示ECharts图表
目标:在leaflet地图坐标直接显示ECharts图表。
原理:leaflet地图的marker上,以echarts的html作为marker的divicon。
<!DOCTYPE html>
<html>
<head>
<metacharset=”utf-8″ />
<style type=”text/css”>
html, body{margin:0; height:100%; }
#map {height:100%;width:100%;}
</style>
<linkrel=”stylesheet” href=”js/leaflet/leaflet.css” />
<scripttype=”text/javascript” src=”js/leaflet/leaflet-src.js”></script>
<script type=”text/javascript”src=”js/echarts/echarts.js” ></script>
<title>LeafletMap Charts Control Demo</title>
</head>
<body>
<divid=’map’></div>
<scripttype=”text/javascript”>
varmap=L.map(‘map’).setView([51.505, -0.09], 13);
L.tileLayer(‘http://{s}.tile.osm.org/{z}/{x}/{y}.png’,{
attribution: ‘© <ahref=”http://osm.org/copyright”>OpenStreetMap</a>contributors’
}).addTo(map);
var myDivIcon=L.divIcon({
className:’leaflet-echart-icon’,
iconSize:[160, 160],
html:'<div id=”marker1″ style=”width: 160px; height: 160px;position: relative; background-color: transparent;”>asd</div>’
});
varmarker=L.marker([51.5, -0.09],{icon:myDivIcon}).addTo(map);
createChart(“marker1”);
//creat echarts
functioncreateChart(divid){
// 基于准备好的dom,初始化echarts实例
var myChart= echarts.init(document.getElementById(divid));
// 指定图表的配置项和数据
option = {
tooltip: {
trigger: ‘axis’
},
xAxis: [{
type: ‘category’,
data: [‘1月’, ‘2月’, ‘3月’, ‘4月’]
}],
yAxis: [{
type: ‘value’,
name: ‘水量(ml)’,
min: 0,
max: 50,
interval: 50,
axisLabel: {
formatter: ‘{value} ‘
}
}, {
type: ‘value’,
name: ‘温度(°C)’,
min: 0,
max: 10,
interval: 5,
axisLabel: {
formatter: ‘{value} ‘
}
}],
series: [{
name: ‘蒸发量’,
type: ‘bar’,
data: [2.0, 4.9, 7.0, 23.2]
}, {
name: ‘降水量’,
type: ‘bar’,
data: [2.6, 5.9, 9.0, 26.4]
}, {
name: ‘平均温度’,
type: ‘line’,
yAxisIndex: 1,
data: [2.0, 2.2, 3.3, 4.5]
}]
};
// 使用刚指定的配置项和数据显示图表。
myChart.setOption(option);
returnmyChart;
}
</script>
</body>
</html>
4.4 Identify地图元素信息:点击地图显示图层对应元素的信息
4.4.1 目标:通过点击获取地图元素信息,在前台气泡展示。
4.4.2 原理:前台使用leaflet.wms.js插件通过jQuery Ajax请求WMS数据,WMS返回数据并在leaflet上展示。使用Mule进行异步跨域操作。
4.4.3 流程
4.4.3.1 添加leaflet.wms插件:使用leaflet.wms.js插件
<script type=”text/javascript” src=”js/leaflet/leaflet.wms.js”>/*addidentify wms*/</script>
4.4.3.2 自定义结果显示:扩展leaflet.wms的source。
var MySource =L.WMS.Source.extend({
‘parseFeatureInfo’: function(result, url) {
// Hook to handle parsing AJAX response
if (result == “error”) {
// AJAX failed, possibly due toCORS issues.
// Try loading content in<iframe>.
result = “<iframesrc='” + url + “‘ style=’border:none’>”;
}
return result;
},
‘showFeatureInfo’: function(latlng, info) {
console.log(info);
// Hook to handle displayingparsed AJAX response to the user
if (!this._map) {
return;
}
this._map.openPopup(info, latlng);
}
});
4.4.3.3 添加查询图层:添加需要显示信息的图层
var source = newMySource(“http://localhost:8081/geoserver/bhxq/wms?”,{
‘transparent’: true,
format:’image/png’,
attribution: “Map© 2016 XXZX”
});
varwmsPlace=source.getLayer(“bhxq:行政地名”).addTo(mymap);
4.4.3.4 将跨域的WMS服务进行同域转发:MULE
参见:..\ESB\Mule.docx 《GET请求参数转发-WMS GetFeatureInfo消息转发》 部分。
4.4.3.5 完整代码
//identify.html
<!DOCTYPE html>
<html>
<head>
<metacharset=”UTF-8″>
<linkrel=”stylesheet” href=”js/leaflet/leaflet.css” />
<style>
html, body{margin:0; height:100%; }
#mapid {height:100%;width: 100%;}
</style>
<scripttype=”text/javascript” src=”js/leaflet/leaflet-src.js”></script>
<scripttype=”application/javascript” src=”js/jquery-3.1.1.js”></script>
<scripttype=”text/javascript”src=”js/leaflet/leaflet.wms.js”>/*add identifywms*/</script>
<title>Identify</title>
</head>
<body>
<divid=”mapid”></div>
<scripttype=”text/javascript”>
//map
var mymap =L.map(‘mapid’).setView([38.88, 117.58], 10);
var wmsBhxq =L.tileLayer.wms(‘http://localhost:8087/geoserver/bhxq/wms?’, {
layers: ‘bhxq:bhxq’,
format: ‘image/png’,
transparent: true,
attribution: “Map© 2016 XXZX”
}).addTo(mymap);
var wmsRoad =L.tileLayer.wms(‘http://localhost:8087/geoserver/bhxq/wms?’, {
layers: ‘bhxq:主要道路’,
format:’image/png’,
transparent: true,
attribution: “Map© 2016 XXZX”
}).addTo(mymap);
//add identifylayer
var MySource =L.WMS.Source.extend({
‘parseFeatureInfo’: function(result, url) {
// Hook to handle parsing AJAX response
if (result == “error”) {
// AJAX failed, possibly due toCORS issues.
// Try loading content in<iframe>.
result = “<iframesrc='” + url + “‘ style=’border:none’>”;
}
return result;
},
‘showFeatureInfo’: function(latlng, info) {
console.log(info);
// Hook to handle displayingparsed AJAX response to the user
if (!this._map) {
return;
}
this._map.openPopup(info, latlng);
}
});
var source = newMySource(“http://localhost:8081/geoserver/bhxq/wms?”,{
‘transparent’:true,
format:’image/png’,
attribution: “Map© 2016 XXZX”
});
varwmsPlace=source.getLayer(“bhxq:行政地名”).addTo(mymap);
var baseLayers ={
“滨海新区”:wmsBhxq,
“主要道路”:wmsRoad,
“行政地名”:wmsPlace
};
L.control.layers(null, baseLayers).addTo(mymap);
</script>
</body>
</html>
4.4.3.6 运行结果
4.5 Identify地图元素信息:JSONP跨域操作
4.5.1 目标:通过点击获取地图元素信息,在前台气泡展示。
4.5.2 原理:前台使用leaflet.wms.js插件通过jQuery Ajax JSONP请求WMS数据,GeoServer返回JSONP数据调用回调函数(默认parseResponse(json)),leaflet调用identify的处理函数(parseFeatureInfo()处理数据,showFeatureInfo()显示数据)上展示。
JSONP原理参见:..\Net\jQuery.docx《JSONP》部分。
GeoServer要求使用info_format=text/javascript标识jsonp请求。
url = this._url + L.Util.getParamString(params, this._url)+’&info_format=text/javascript’;//usejsonp
客户端使用datatype=jsonp标识。
$.ajax({
type:”get”,
url: url,
dataType:’jsonp’
});
GeoServer开启JSONP支持参见:GeoServer.docx《JSONP》部分。
注意:如果跨域不成功,可以使用iframe进行基本展示。
result = “<iframesrc='” + url + “‘ style=’border:none’>”;
注意:由于jsonp调用指定函数,需要暴露parseResponse()函数(为什么不能调用success()???)。
4.5.3 流程:
4.5.3.1 GeoServer服务器开启JSONP支持
参见:GeoServer.docx《JSONP》部分。
4.5.3.2 添加leaflet.wms插件:使用leaflet.wms.js插件
<scripttype=”text/javascript”src=”js/leaflet/leaflet.wms.js”></script>
4.5.3.3 构造JSONP请求、自定义结果显示:扩展leaflet.wms的source。
URL添加info_format=text/javascript标识为jsonp请求。format_options=callback:回调函数名指定回调函数。
ajax添加datatype=jsonp标识。jsonpCallback:回调函数名在jquery中注册回调函数,有jquery进行转码。
//JSON Identify Object
var DataCenterSource =L.WMS.Source.extend({
‘getFeatureInfo’: function(point, latlng, layers, callback){//request wms jsonp info
// Request WMSGetFeatureInfo and call callback with results
// (split from identify()to faciliate use outside of map events)
varsuccessFunction=’success_parseResponse’;
var params =this.getFeatureInfoParams(point, layers),
url = this._url +L.Util.getParamString(params, this._url)+’&info_format=text/javascript’+’&format_options=callback:’+successFunction;//usejsonp,指定jsonp的回调函数
this._wms_url=url;//for iframe get request
this.showWaiting();
this.clickPos=latlng;//popup position
$.ajax({
async:false,
type: “get”,
url: url,
dataType:’jsonp’,
jsonpCallback:successFunction,
success:function(response){//thisfunction will be called by jsonpCallback function
console.log(‘success’);
//console.log(source);
source.hideWaiting();
var text = source.parseFeatureInfo(response,source._url_wms);
source.showFeatureInfo(source.clickPos,JSON.stringify(text));
}
});
},
‘parseFeatureInfo’: function(result, url){//process response info here
// Hook to handle parsing AJAX response
if (result == “error”) {
// AJAX failed, possibly due toCORS issues.
// Try loading content in<iframe>.
result = “<iframe src='” + url +”‘ style=’border:none’>”;
}
return result;
},
‘showFeatureInfo’: function(latlng, info){//open popup
console.log(‘showFeatureInfo=’+info);
// Hook to handle displayingparsed AJAX response to the user
if(!this._map) {
return;
}
this._map.openPopup(info, latlng);
}
});
4.5.3.4 添加查询图层:添加需要显示信息的图层
//add identify layer
varsource = newDataCenterSource(“http://localhost:8087/geoserver/bhxq/wms?”,{
‘transparent’:true,
format:’image/png’,
attribution: “Map© 2016 XXZX”
});
varwmsPlace=source.getLayer(“bhxq:行政地名”).addTo(mymap);
4.5.3.5 完整代码
//identify-jsonp.html
<!DOCTYPE html>
<html>
<head>
<meta charset=”UTF-8″>
<link rel=”stylesheet” href=”js/leaflet/leaflet.css”/>
<style>
html, body{ margin:0; height:100%; }
#mapid {height: 100%;width: 100%;}
</style>
<script type=”text/javascript”src=”js/leaflet/leaflet-src.js” ></script>
<script type=”application/javascript”src=”js/jquery-3.1.1.js”></script>
<script type=”text/javascript”src=”js/leaflet/leaflet.wms.js”></script>
<script type=”text/javascript”src=”js/leaflet.wms.datacenter.js” ></script>
<title>Identify</title>
</head>
<body>
<div id=”mapid”></div>
<script type=”text/javascript”>
//map
var mymap = L.map(‘mapid’).setView([38.88, 117.58],10);
var wmsBhxq =L.tileLayer.wms(‘http://localhost:8087/geoserver/bhxq/wms?’, {
layers:’bhxq:bhxq’,
format:’image/png’,
transparent: true,
attribution: “Map© 2016 XXZX”
}).addTo(mymap);
var wmsRoad =L.tileLayer.wms(‘http://localhost:8087/geoserver/bhxq/wms?’, {
layers:’bhxq:主要道路’,
format:’image/png’,
transparent: true,
attribution: “Map©2016 XXZX”
}).addTo(mymap);
//add identify layer
varsource = newDataCenterSource(“http://localhost:8087/geoserver/bhxq/wms?”,{
‘transparent’: true,
format:’image/png’,
attribution: “Map© 2016 XXZX”
});
varwmsPlace=source.getLayer(“bhxq:行政地名”).addTo(mymap);
var baseLayers = {
“滨海新区”: wmsBhxq,
“主要道路”: wmsRoad,
“行政地名”: wmsPlace
};
L.control.layers(null, baseLayers).addTo(mymap);
</script>
</body>
</html>
//leaflet.wms.datacenter.js
//JSON Identify Object
var DataCenterSource =L.WMS.Source.extend({
‘getFeatureInfo’: function(point, latlng, layers, callback){//request wms jsonp info
// Request WMSGetFeatureInfo and call callback with results
// (split fromidentify() to faciliate use outside of map events)
varsuccessFunction=’success_parseResponse’;
var params =this.getFeatureInfoParams(point, layers),
url = this._url +L.Util.getParamString(params,this._url)+’&info_format=text/javascript’+’&format_options=callback:’+successFunction;//usejsonp,指定jsonp的回调函数
this._wms_url=url;//for iframe get request
this.showWaiting();
this.clickPos=latlng;//popup position
$.ajax({
async:false,
type: “get”,
url: url,
dataType:’jsonp’,
jsonpCallback:successFunction,
success:function(response){//thisfunction will be called by jsonpCallback function
console.log(‘success’);
//console.log(source);
source.hideWaiting();
var text = source.parseFeatureInfo(response,source._url_wms);
source.showFeatureInfo(source.clickPos,JSON.stringify(text));
}
});
},
‘parseFeatureInfo’: function(result, url){//process response info here
// Hook to handle parsing AJAX response
if (result == “error”) {
// AJAX failed, possibly due toCORS issues.
// Try loading content in<iframe>.
result = “<iframesrc='” + url + “‘ style=’border:none’>”;
}
return result;
},
‘showFeatureInfo’: function(latlng, info){//open popup
console.log(‘showFeatureInfo=’+info);
// Hook to handle displayingparsed AJAX response to the user
if(!this._map) {
return;
}
this._map.openPopup(info, latlng);
}
});
////process identify info
//functionparseResponse(response){
// //console.log(source);
// source.hideWaiting();
// var text = source.parseFeatureInfo(response,source._url_wms);
// source.showFeatureInfo(source.clickPos,JSON.stringify(text));
//}
//functionsuccess_parseResponse(response){//外部的回调函数,会优先调用
// console.log(‘outter success…’+JSON.stringify(response));
//}
4.5.3.6 运行结果
请求
响应
success_parseResponse({“type”:”FeatureCollection”,”totalFeatures”:”unknown”,”features”:[{“type”:”Feature”,”id”:”行政地名.98″,”geometry”:{“type”:”Point”,”coordinates”:[117.32804859057012,38.83744788501207]},”geometry_name”:”the_geom”,”properties”:{“OBJECTID”:2782,”Name”:”万家码头村”,”Name_PY”:”WanJiaMaTouCun”,”Ctype”:”自然村名称”,”Ntype”:”190108″,”Code”:”120116″,”Address”:””,”Telephone”:””,”label”:”万家码头村”}}],”crs”:{“type”:”name”,”properties”:{“name”:”urn:ogc:def:crs:EPSG::4490″}}})
转载自:https://blog.csdn.net/Tongsui/article/details/81666034