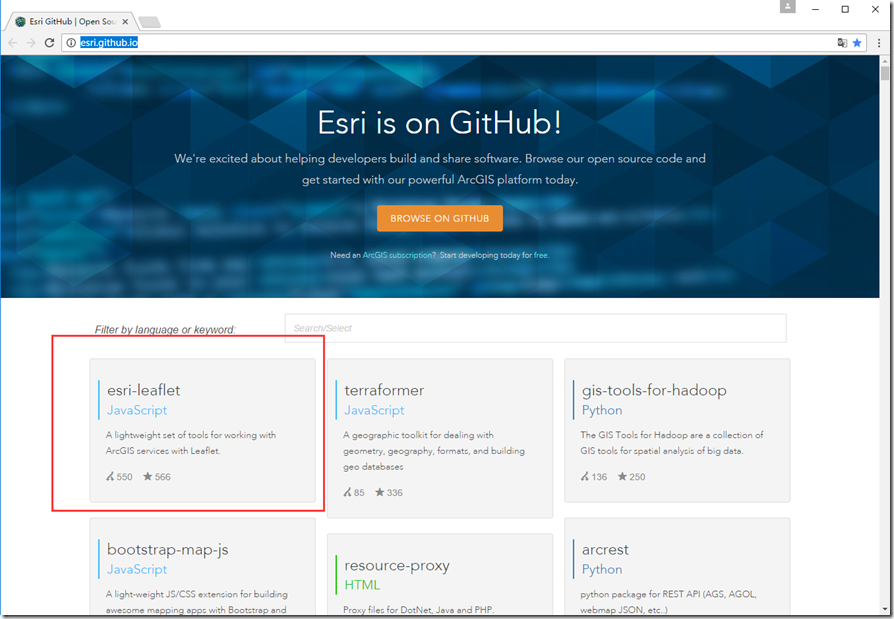
leaflet官网上的部分例子
leaflet官网上的部分例子
试一试就能明白
<!DOCTYPE html PUBLIC "-//W3C//DTD XHTML 1.0 Transitional//EN" "http://www.w3.org/TR/xhtml1/DTD/xhtml1-transitional.dtd">
<html xmlns="http://www.w3.org/1999/xhtml">
<head>
<meta http-equiv="Content-Type" content="text/html; charset=gb2312" />
<title>无标题文档</title>
<link rel="stylesheet" href="http://cdn.leafletjs.com/leaflet-0.7.3/leaflet.css" />
<script src="http://cdn.leafletjs.com/leaflet-0.7.3/leaflet.js"></script>
<style type="text/css">
#map { height: 500px; }
</style>
</head>
<body>
<div id="map"></div>
<script type="text/javascript">
//获取切片数据的URL,x,y是切片的坐标,z是缩放级别
var osmUrl = 'http://{s}.tile.openstreetmap.org/{z}/{x}/{y}.png',
osm = L.tileLayer(osmUrl, {
maxZoom: 17,
attribution: 'Li © <a href="#">LiOpen</a> contributors'
});
//创建map对象,设置地图中心和缩放级别
var map = L.map('map');
map.setView([50.5, 30.51], 8);
map.addLayer(osm);
//创建marker,添加标注,添加弹出气泡
var marker = new L.Marker(new L.latLng(50.5, 30.51));
marker.bindPopup('这个是infowindow对象');//创建infowindow
map.addLayer(marker);
//添加圆形,添加弹出气泡
var circle = L.circle([50.1, 30], 500, {
color: 'red',
fillColor: '#f03',
fillOpacity: 0.5
}).addTo(map);
circle.bindPopup("I am a circle.").openPopup();
//添加多边形,添加弹出气泡
var polygon = L.polygon([
[51.509, 32],
[51.503, 32.5],
[51.69, 32.6]
]).addTo(map);
polygon.bindPopup("I am a polygon.");
//处理事件
var popup = L.popup()
.setLatLng([51.5, 30])
.setContent("I am a popup.")
.openOn(map);
var popup2 = L.popup();
function onMapClick(e) {
popup2
.setLatLng(e.latlng)
.setContent("You clicked the map at " + e.latlng.toString())
.openOn(map);
}
map.on('click', onMapClick);
//自定义图标
var greenIcon = L.icon({
iconUrl: 'leaf-green.png',
shadowUrl: 'leaf-shadow.png',
iconSize: [38, 95], // 图标大小
shadowSize: [50, 64], // 阴影大小
iconAnchor: [22, 94], // 图标上的一点为标记的位置
shadowAnchor: [4, 62], // 阴影上的一点为标记的位置
popupAnchor: [-3, -76] // 点击图标后气泡弹出的位置
});
L.marker([51.5, 30.9], {icon: greenIcon}).addTo(map).bindPopup("I am a green leaf.");
//图标共有部分
var LeafIcon = L.Icon.extend({
options: {
shadowUrl: 'leaf-shadow.png',
iconSize: [38, 95],
shadowSize: [50, 64],
iconAnchor: [22, 94],
shadowAnchor: [4, 62],
popupAnchor: [-3, -76]
}
});
var redIcon = new LeafIcon({iconUrl: 'leaf-red.png'}),
orangeIcon = new LeafIcon({iconUrl: 'leaf-orange.png'});
/*大小写原因
L.icon = function (options) {
return new L.Icon(options);
};*/
L.marker([51.3, 30.7], {icon: redIcon}).addTo(map).bindPopup("I am a red leaf.");
L.marker([51.1, 30.5], {icon: orangeIcon}).addTo(map).bindPopup("I am an orange leaf.");
//geojson例子
//例1、折线
var myLines = [{
"type": "LineString",
"coordinates": [[-100, 40], [-105, 45], [-110, 55]]
}, {
"type": "LineString",
"coordinates": [[-105, 40], [-110, 45], [-115, 55]]
}];
var myStyle = {
"color": "#ff7800",
"weight": 5,
"opacity": 0.65
};
L.geoJson(myLines, {
style: myStyle
}).addTo(map);
//例2、多边形
var states = [{
"type": "Feature",
"properties": {"party": "Republican"},
"geometry": {
"type": "Polygon",
"coordinates": [[
[-104.05, 48.99],
[-97.22, 48.98],
[-96.58, 45.94],
[-104.03, 45.94],
[-104.05, 48.99]
]]
}
}, {
"type": "Feature",
"properties": {"party": "Democrat"},
"geometry": {
"type": "Polygon",
"coordinates": [[
[-109.05, 41.00],
[-102.06, 40.99],
[-102.03, 36.99],
[-109.04, 36.99],
[-109.05, 41.00]
]]
}
}];
L.geoJson(states, {
style: function(feature) {
switch (feature.properties.party) {
case 'Republican': return {color: "#ff0000"};
case 'Democrat': return {color: "#0000ff"};
}
}
}).addTo(map);
</script>
</body>
</html>


转载自:https://blog.csdn.net/u013982329/article/details/50457150