R语言之数据可视化—地图可视化leaflet包(上)
目录
包的github链接地址:https://github.com/rstudio/leaflet
基于leaflet的中文扩展包出自chiffon大大github地址:https://github.com/Lchiffon/leafletCN
一.安装方式:
可见作者关于安装的文章
二.使用方法:
-
leaflet的一些用法介绍:
library(leaflet)
m<-leaflet()
at<-addTiles(m)
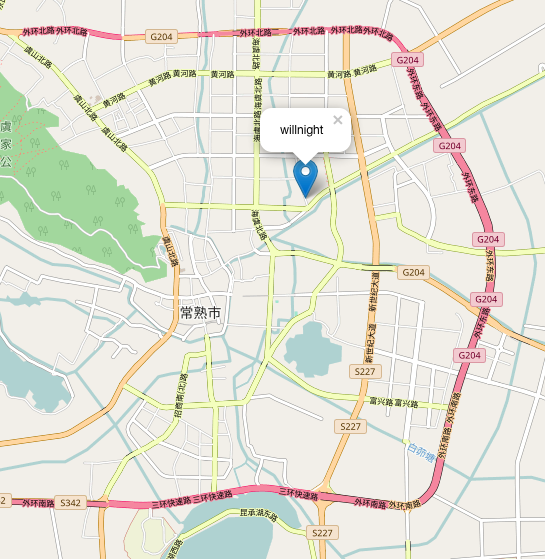
addMarkers(at,lng = 120.7588630000,lat =31.6597700000 ,popup = ‘willnight’)
也可用管道操作(推荐):
leaflet()%>%addTiles()%>%addMarkers(lng = 120.7588630000,lat = 31.6597700000,popup = ‘willnight’)
leaflet1.png
设置地图大小:可通过zoom参数控制
leaflet()%>%setView(lng=120.758863,lat=31.659770,zoom=9)%>%addTiles()
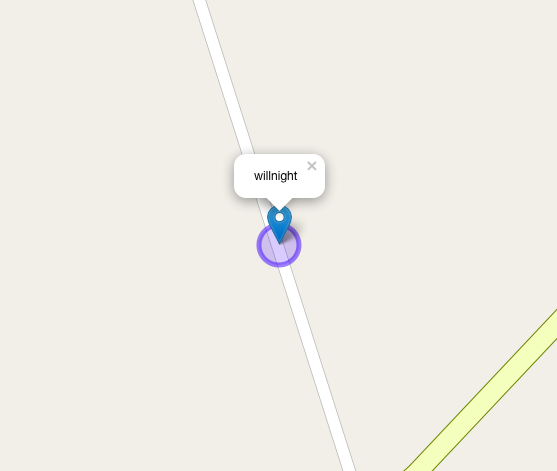
添加圆圈等小功能:(实例展示:http://xwj.565tech.com/jianshu/leaflet1.html )
leaflet()%>%addTiles()%>%addMarkers(lng = 120.7588630000,lat = 31.6597700000,popup = ‘willnight’)%>%addCircles(lng = 120.7588630000,lat = 31.6597700000)
leaflet2.png还有一些小功能可以在R中用?help的方式获取用法,基本都是类似的!!!
2.地图缩小聚合:(实例展示:http://xwj.565tech.com/jianshu/leaflet2.html )
标记图钉
df<-data.frame(lat=runif(20,min=0,max=70),lon=runif(20,0,160))
df%>%leaflet()%>%addTiles()%>%addMarkers()
自定义图标
makeIcon的语法如下:
iconUrl : 图标的url地址
iconWidth :图标的宽度
iconHeight: 图标的高度
iconAnchorX :图标的中心点x轴偏移(以左上角为0,0)
iconAnchorY :图标的中心点Y轴偏移(以左上角为0,0)
redIcon <- makeIcon(
iconUrl = “http://img.blog.csdn.net/20161015170050664“,
iconWidth = 38, iconHeight = 38,
iconAnchorX = 19, iconAnchorY = 19
)
df%>%leaflet()%>%addTiles()%>%addMarkers(icon=redIcon)
用不同的图标表示不同的类别
redIcon1 <- makeIcon(
iconUrl = “http://img.blog.csdn.net/20161015170050664“,
iconWidth = 38, iconHeight = 38,
iconAnchorX = 19, iconAnchorY = 19
)
redIcon2 <- makeIcon(
iconUrl = “http://img.blog.csdn.net/20161015173507516“,
iconWidth = 38, iconHeight = 38,
iconAnchorX = 19, iconAnchorY = 19
)
leaflet()%>%addTiles()%>%addMarkers(data=df[1:10,],icon=redIcon1)%>%addMarkers(data=df[11:20,],icon=redIcon2)
makeicon支持r中的ifelse
leafIcons <- icons(
iconUrl = ifelse(bj3H$dj==”三级”,
“http://img.blog.csdn.net/20161015170050664“,
“http://img.blog.csdn.net/20161015173507516“
),
iconWidth = 38, iconHeight = 38,
iconAnchorX = 19, iconAnchorY = 19
)
leaflet(bj3H)%>%addProviderTiles(“CartoDB.Positron”)%>%
addMarkers(popup=~mc,icon = leafIcons)
更多类别的图标
yyIcons <- iconList(
中国医科院所属医院 = makeIcon(“http://img.blog.csdn.net/20161015181859390“, iconWidth =32, iconHeight = 32),
北京区县属医院 = makeIcon(“http://img.blog.csdn.net/20161015182217958“, iconWidth =32, iconHeight = 32),
北京市卫生局直属医院= makeIcon(“http://img.blog.csdn.net/20161015181915828“,iconWidth =32, iconHeight = 32),
北京中医药大学= makeIcon(“http://img.blog.csdn.net/20161015181934175“,iconWidth =32, iconHeight = 32),
卫生部直属医院= makeIcon(“http://img.blog.csdn.net/20161015181950879“,iconWidth =32, iconHeight = 32),
中国中医科学院= makeIcon(“http://img.blog.csdn.net/20161015182031737“,iconWidth =32, iconHeight = 32),
驻京武警医院= makeIcon(“http://img.blog.csdn.net/20161015182043285“,iconWidth =32, iconHeight = 32),
驻京部队医院= makeIcon(“http://img.blog.csdn.net/20161015182054598“,iconWidth =32, iconHeight = 32),
部属厂矿高校医院= makeIcon(“http://img.blog.csdn.net/20161015182109473“,iconWidth =32, iconHeight = 32),
北京大学附属医院= makeIcon(“http://img.blog.csdn.net/20161015182132521“,iconWidth =32, iconHeight = 32)
)
leaflet(bj3H) %>%addProviderTiles(“CartoDB.Positron”) %>%
addMarkers(icon = yyIcons[fl],popup=fl)
自动聚合图标
df%>%leaflet()%>%addTiles()%>%addMarkers(clusterOptions = markerClusterOptions(),data=df[1:10,],icon=redIcon1)%>%addMarkers(clusterOptions = markerClusterOptions(),data=df[11:20,],icon=redIcon2)
demo
leaflet(bj3H) %>%addProviderTiles(“CartoDB.Positron”) %>%
addMarkers(clusterOptions = markerClusterOptions(),icon = yyIcons[fl],popup=fl)
可实现地图缩小聚合的效果
3.图标弹窗:(实例展示:http://xwj.565tech.com/jianshu/leaflet3.html )
tiananm <- paste(
             "<p>","天安门,坐落在中华人民共和国首都北京市的中心、


             故宫的南端,与天安门广场以及人民英雄纪念碑、毛主席纪念堂、

             人民大会堂、中国国家博物馆隔长安街相望,占地面积4800平方米,

             以杰出的建筑艺术和特殊的政治地位为世人所瞩目。","</p>",

             "<a href='http://www.tiananmen.org.cn/index.htm'>点击查看更多</a>",

             "<p><img src='http://img.blog.csdn.NET/20161016004301807' width='50%'></p>",

             "<p><img src='http://img.blog.csdn.Net/20161016005048911' width='50%'></p>"
)
leaflet()%>%addTiles()%>%addMarkers(lng=116.391, lat=39.906, popup=tiananm)
4.矩形框点击弹出文本:(实例展示:http://xwj.565tech.com/jianshu/leaflet4.html )
leaflet() %>%addProviderTiles(“Esri.WorldImagery”) %>%
addRectangles(
lng1=116.1, lat1=39.7,
lng2=116.63, lat2=40.1,
weight = 3,color = “red”,fillColor = “transparent”,
opacity = 1,popup=“willnight”
)
leaflet包上篇就先介绍到这边,各位可以结合自身需求,去定制个性化的可视化地图,结合前面介绍的baidumap包获取经纬度,基本大多数地图可视化功能都可以实现,下篇将介绍leafletCN和一些地图主题!!!
部分代码参考虾神的博客:http://blog.csdn.net/allenlu2008/article/details/52816708
转载自:https://blog.csdn.net/weixin_34200628/article/details/87491022