openlayer加载矢量切片
数据是GIS的灵魂,没有数据也就谈不上GIS了,数据分为矢量数据和栅格数据,栅格数据也有一些短处,缺乏灵活性、实时性,数据完整性受损是比较突出的问题,矢量数据不同于栅格数据,比较灵活,数据完整,将两者结合诞生出—>矢量切片,不要被矢量这个词迷惑,矢量切片是不可被编辑的,不可编辑不代表不能获取其属性信息。
矢量数据的优点:
矢量切片可以以三种形式呈现:GeoJSON、TopoJSON 和 MapBox Vector Tile(.mvt),矢量切片技术继承了矢量数据和切片地图的双重优势,有如下优点:
1、 对于栅格切片,更灵活,更细粒度的数据划分,要素级别;
2、 数据信息接近无损,但体积更小,请求指定地物的信息,直接在客户端获取,无需再次请求服务器;
3、样式可改变和定制(重点),矢量切片可以在客户端或者服务器端渲染,可以按照用户赋予的样式渲染;
4、对于原始矢量数据,更小巧,采用了重新编码,并进行了切分,只返回请求区域和相应级别的数据;
5、数据更新快,或者说是实时的,当数据库中的空间数据变化后,再次请求的数据是改变后的,在客户端渲染后既是最新的情况;
6、 更灵活,可以只是返回每个专题数据的图层,而不是像栅格切片把很多专题数据渲染在一个底图中。
详细介绍参考https://blog.csdn.net/qingyafan/article/details/53367204
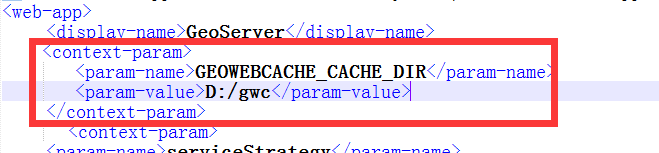
关于切片的制作我采用的是geoserver版本2.14,具体过程在这里不再说了可以参考:http://www.cnblogs.com/escage/p/6387529.html
一、采用geojson加载方式
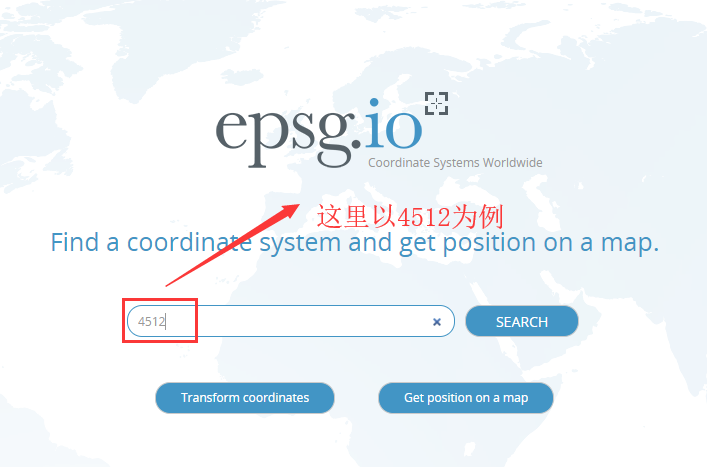
        //投影1 Geoserver和OpenLayer都支持的4326坐标系
        var projection4326 = new ol.proj.Projection({
            code: 'EPSG:4326',
            units: 'degrees',
            axisOrientation: 'neu'
        });
        var layerProjection = "4326";
        //参数设置:图层名称 / 投影坐标系 / 初始化样式
        var layer = "cite:beijing1";
        var initStyle = new ol.style.Style({
                fill: new ol.style.Fill({
                    color: 'rgba(255, 255, 255, 0.2)'
                }),
                stroke: new ol.style.Stroke({
                    color: 'red',
                    width: 2
                }),
                image: new ol.style.Circle({
                    radius: 7,
                    fill: new ol.style.Fill({
                        color: '#ffcc33'
                    })
                })
        });
        var vector = new ol.layer.VectorTile({
            title: "北京市道路-VectorTile",
            style: initStyle,
            projection: projection4326,
                 //矢量切片数据
            source: new ol.source.VectorTile({
                       projeciton: projection4326,
                format: new ol.format.GeoJSON(),
                tileGrid: ol.tilegrid.createXYZ({
                              extent: ol.proj.get('EPSG:4326').getExtent(),
                              maxZoom: 22
                }),
                       tilePixelRatio: 1,
                       //发出获取切片的请求
                       tileUrlFunction: function (tileCoord) {
                           return 'http://localhost:8080/geoserver/gwc/service/tms/1.0.0/'
                        + layer + '@EPSG%3A' + layerProjection + '@geojson/' + (tileCoord[0] - 1)
                        + '/' + tileCoord[1] + '/' + (Math.pow(2, tileCoord[0] - 1) + tileCoord[2]) + '.geojson';

                }
                  })
            });
二、采用pbf方式加载
        //投影1 Geoserver和OpenLayer都支持的4326坐标系
        var projection4326 = new ol.proj.Projection({
            code: 'EPSG:4326',
            units: 'degrees',
            axisOrientation: 'neu'
        });
        var layerProjection = "4326";
        //参数设置:图层名称 / 投影坐标系 / 初始化样式
        var initStyle = new ol.style.Style({
                fill: new ol.style.Fill({
                    color: 'rgba(255, 255, 255, 0.2)'
                }),
                stroke: new ol.style.Stroke({
                    color: 'red',
                    width: 2
                }),
                image: new ol.style.Circle({
                    radius: 7,
                    fill: new ol.style.Fill({
                        color: '#ffcc33'
                    })
                })
        });
 //图层名
        var layerName = 'cite:university';
        //切片资源1 基于4326坐标系统
        var source4326 = new ol.source.VectorTile ({
                title: "国内大学分布-VectorTile",
                format: new ol.format.MVT(),
                projection: projection4326,
                //切片格网直接有4326坐标系统的坐标范围与缩放大小指定,因此每一级的都是固定的
                tileGrid: ol.tilegrid.createXYZ({
                    extent: ol.proj.get('EPSG:4326').getExtent(),
                    maxZoom: 22
                }),
                tilePixelRatio: 1,
                tileUrlFunction: function (tileCoord) {
                    return 'http://localhost:8080/geoserver/gwc/service/tms/1.0.0/' + layerName + '@EPSG%3A4326@pbf/' + (tileCoord[0] - 1)
                        + '/' + tileCoord[1] + '/' + (Math.pow(2, tileCoord[0] - 1) + tileCoord[2]) + '.pbf';
                }
            })
        var vectorTile = new ol.layer.VectorTile
            ({
                style: initStyle,
                projection: projection4326,
                source: source4326
            });
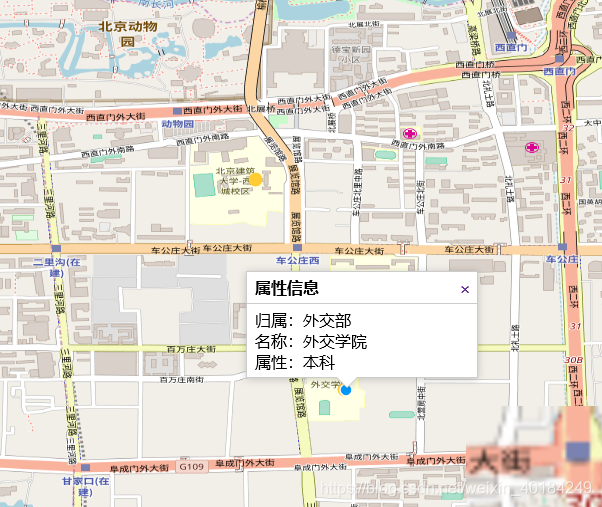
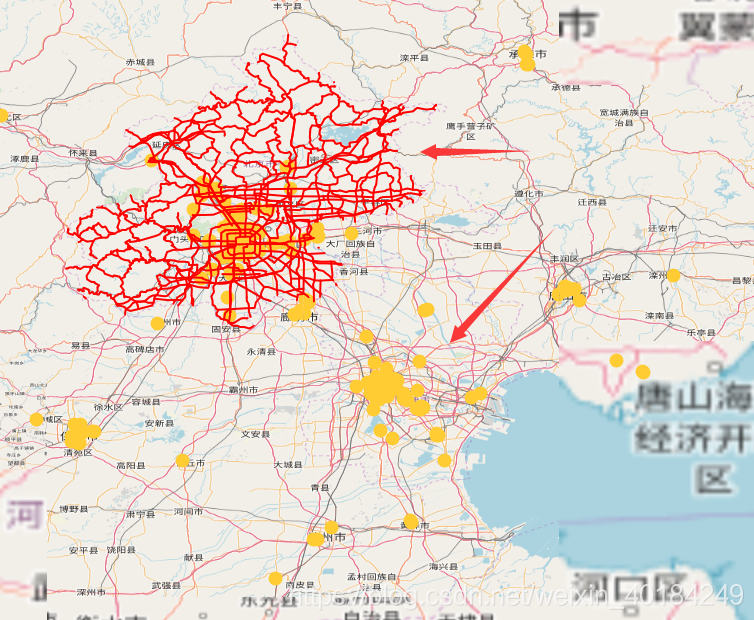
三、效果图
1、获取属性信息
2、整体效果
转载自:https://blog.csdn.net/weixin_40184249/article/details/83478900