OpenLayer4实现自定义标注
前言:OL可以让我们实现自定义的标注样式,用过CAD的同学应该都知道CAD中有上下文字中间用横线隔开的样式,这样标注让人一目了然的了解信息。给人以直观的的信息表达,本文实现就是分式的标注。
先来张图:
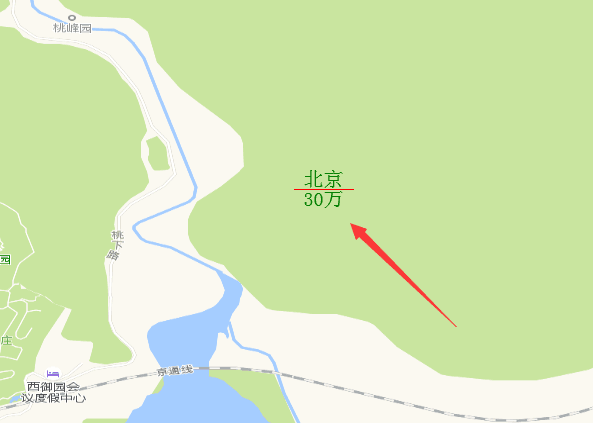
该类中有一个img参数,该参数非常好用,该参数的输入类型为Image | HTMLCanvasElement,第二个类型就是canvas标签,作为一个GIS开发人员,相信大家对canvas标签不在陌生,支持我们画一些图形等,但是该参数必须和imgSize参数一块使用。
二、实现原理
上下的文字通过设置ol.style.Text样式,底部的文字进行在Y方向上偏移一部分,中间的运用ol.style.Icon,用canvas画横线,将横线通过ol.style.Icon封成一个ol.style.Style,最终通过一个函数将三者的结合一起来返回一个styles数组,赋值vector图层的styleFunc函数
三、主要代码
        //构造顶部文字样式的样式
        var createTextStyleA = function (fieldValue) {
            var style = new ol.style.Style({
                text:  new ol.style.Text({
                    textAlign: "center",
                    textBaseline: "middle",
                    font: " 20px serif",
                    text: "北京",
                    fill: new ol.style.Fill({ color: 'green' }),
                    stroke: new ol.style.Stroke({ color: 'rgba(255,255,255,0)' }),
                    offsetX: 10,
                    offsetY: 0,
                    rotation: 0
                })

            });
            return style;
        }
        //构造底部文字样式
        var createTextStyleB = function (fieldValue) {
            var style = new ol.style.Style({
                text: new ol.style.Text({
                    textAlign: "center",
                    textBaseLine: "middle",
                    font: "20px serif",
                    text: "30万",
                    fill: new ol.style.Fill({ color: 'green' }),
                    stroke: new ol.style.Stroke({ color: 'rgba(255,255,255,0)' }),
                    offsetX: 10,
                    offsetY: 20,
                    rotation: 0
                })

            });
            return style;
        }
        //构造线样式
        var createLineStyle = function (textA) {
            var canvas = document.createElement('canvas');
            canvas.width = 80;
            canvas.height = 20;
            var ctx = canvas.getContext("2d");
            ctx.lineWidth = 2;
            ctx.strokeStyle = "red";
            ctx.beginPath(); //新建一条path
            ctx.moveTo(0, 0);
            ctx.lineTo(textA.length*30,0);
            //画线
            ctx.stroke();
            //封闭路径
            ctx.closePath();
            var lineStyle = new ol.style.Style({
                image: new ol.style.Icon({
                    img: canvas,
                    imgSize: [canvas.width, canvas.height],
                    rotation: 180 * Math.PI/180
                })
            });
            return lineStyle;
        }
        //三种样式结合
        var combineStyle = function (textA,textB) {
            var styles = [];
            var textStyleA = createTextStyleA(textA);
            var line = createLineStyle(textA);
            var textStyleB = createTextStyleB(textB);
            styles.push(textStyleA);
            styles.push(line);
            styles.push(textStyleB);
            return styles;
        }
该部分的代码我只是进行简单的应用,有兴趣的同学可以进步进行封装,横线的图标需要进行适当的旋转,还有进行横线的长度,应该选用最长的文字那部分,作为横线的长度。
四、完整demo
<!DOCTYPE html>
<html>
<head>
    <meta charset="utf-8" />
    <title>自定义标注</title>
    <link rel="stylesheet" href="https://openlayers.org/en/v4.5.0/css/ol.css" type="text/css">
    <script src="https://openlayers.org/en/v4.5.0/build/ol.js"></script>
    <script src="../../Scripts/jquery/jquery-3.1.1.min.js"></script>
    <style type="text/css">
        body, #map {
            border: 0px;
            margin: 0px;
            padding: 0px;
            width: 100%;
            height: 100%;
            font-size: 13px;
            overflow: hidden;
        }

    </style>
</head>
<body>
    <div id="map"></div>
    <script>
        var projection = new ol.proj.Projection({
            code: 'EPSG:4326',
            units: 'degrees'
        });
        function getNavmapLayer() {
            return new ol.layer.Tile({
                source: new ol.source.XYZ({
                    url: 'http://webrd01.is.autonavi.com/appmaptile?x={x}&y={y}&z={z}&lang=zh_cn&size=1&scale=1&style=8'//7,8
                }),
                projection: projection
            });
        }
        var navlayer = getNavmapLayer();
        map = new ol.Map({
            controls: ol.control.defaults({
                attribution: false
            }),
            target: 'map',
            layers: [navlayer],
            view: new ol.View({
                projection: projection,
                center: [116.456, 40.251],
                zoom: 4
            })
        });
        var coordinate = [116.456, 40.251];
        //构造顶部文字样式的样式
        var createTextStyleA = function (fieldValue) {
            var style = new ol.style.Style({
                text:  new ol.style.Text({
                    textAlign: "center",
                    textBaseline: "middle",
                    font: " 20px serif",
                    text: "北京",
                    fill: new ol.style.Fill({ color: 'green' }),
                    stroke: new ol.style.Stroke({ color: 'rgba(255,255,255,0)' }),
                    offsetX: 10,
                    offsetY: 0,
                    rotation: 0
                })

            });
            return style;
        }
        //构造底部文字样式
        var createTextStyleB = function (fieldValue) {
            var style = new ol.style.Style({
                text: new ol.style.Text({
                    textAlign: "center",
                    textBaseLine: "middle",
                    font: "20px serif",
                    text: "30万",
                    fill: new ol.style.Fill({ color: 'green' }),
                    stroke: new ol.style.Stroke({ color: 'rgba(255,255,255,0)' }),
                    offsetX: 10,
                    offsetY: 20,
                    rotation: 0
                })

            });
            return style;
        }
        //构造线样式
        var createLineStyle = function (textA) {
            var canvas = document.createElement('canvas');
            canvas.width = 80;
            canvas.height = 20;
            var ctx = canvas.getContext("2d");
            ctx.lineWidth = 2;
            ctx.strokeStyle = "red";
            ctx.beginPath(); //新建一条path
            ctx.moveTo(0, 0);
            ctx.lineTo(textA.length*30,0);
            //画线
            ctx.stroke();
            //封闭路径
            ctx.closePath();
            var lineStyle = new ol.style.Style({
                image: new ol.style.Icon({
                    img: canvas,
                    imgSize: [canvas.width, canvas.height],
                    rotation: 180 * Math.PI/180
                })
            });
            return lineStyle;
        }
        //三种样式结合
        var combineStyle = function (textA,textB) {
            var styles = [];
            var textStyleA = createTextStyleA(textA);
            var line = createLineStyle(textA);
            var textStyleB = createTextStyleB(textB);
            styles.push(textStyleA);
            styles.push(line);
            styles.push(textStyleB);
            return styles;
        }
        var source = new ol.source.Vector();
        var vector = new ol.layer.Vector({
            source: source,
            style: combineStyle("北京")
        });
        map.addLayer(vector);
        var point = new ol.geom.Point(coordinate);
        var feature = new ol.Feature({
            geometry: point,
        });
        source.addFeature(feature);
    </script>
</body>
</html>
转载自:https://blog.csdn.net/weixin_40184249/article/details/82354329