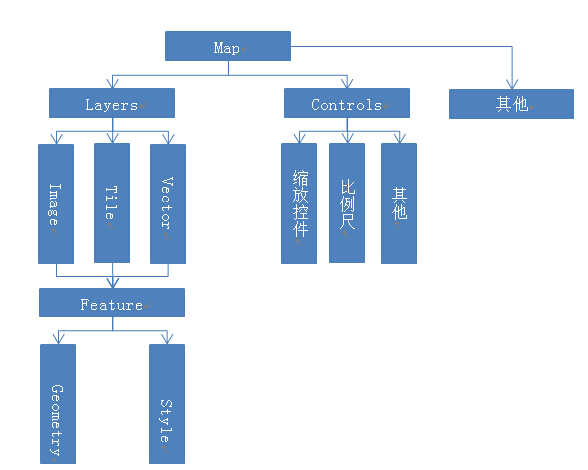
根据新的地图图幅编号,在openlayers上显示图幅范围和图幅号
因为性能关系,在Openlayers上同时显示过多时会造成卡顿,这里做成了根据图幅号查询图幅,并在地图显示。注意这里使用的是最新的图幅编号。
代码是使用Vue写的,借鉴的时候需要注意一下
selectMapNumber() {
const that = this;
this.$prompt("请输入图幅号", "图幅选取", {
confirmButtonText: "确定",
cancelButtonText: "取消",
inputErrorMessage: "格式不正确"
})
.then(({ value }) => {
that.computeMapExtent(value);
})
.catch(err => {
console.log(err);
});
},
computeMapExtent(val) {
var length = val.length;
switch (length) {
case 3:
this.split3(val);
break;
case 10:
this.split10(val);
break;
case 12:
this.split12(val);
break;
default:
alert("图幅格式错误!");
break;
}
},
split3(lesson) {
var code = new Array(2);
code[0] = lesson.slice(0, 1);
code[1] = lesson.slice(1, 3);
this.changeCode2("A");
this.LatR = (this.changeCode0(code[0]) - 1) * 4;
this.LongR = (parseInt(code[1]) - 31) * 6;
this.outPutExtent(
this.LatR,
this.LongR,
this.LatR + this.Lat,
this.LongR + this.Long,
lesson
);
},
split10(lesson) {
var code = new Array(5);
code[0] = lesson.slice(0, 1);
code[1] = lesson.slice(1, 3);
code[2] = lesson.slice(3, 4);
code[3] = lesson.slice(4, 7);
code[4] = lesson.slice(7, 10);
this.changeCode2(code[2]);
this.LatR =
(this.changeCode0(code[0]) - 1) * 4 +
(4 / this.Lat - parseInt(code[3])) * this.Lat;
this.LongR =
(parseInt(code[1]) - 31) * 6 + parseInt(code[4] - 1) * this.Long;
this.outPutExtent(
this.LatR,
this.LongR,
this.LatR + this.Lat,
this.LongR + this.Long,
lesson
);
},
split12(lesson) {
var code = new Array(5);
code[0] = lesson.slice(0, 1);
code[1] = lesson.slice(1, 3);
code[2] = lesson.slice(3, 4);
code[3] = lesson.slice(4, 8);
code[4] = lesson.slice(8, 12);
this.changeCode2(code[2]);
this.LatR =
(this.changeCode0(code[0]) - 1) * 4 +
(4 / this.lat - parseInt(code[3])) * this.Lat;
this.LongR =
(parseInt(code[1]) - 31) * 6 + parseInt(code[4] - 1) * this.Long;
this.outPutExtent(
this.LatR,
this.LongR,
this.LatR + this.Lat,
this.LongR + this.Long,
lesson
);
},
changeCode0(C) {
return C.charCodeAt() - 64;
},
changeCode2(C) {
var num = C.charCodeAt() - 64;
this.Long = this.Lat = 0;
if (num == 1) {
//1:100万
this.Long = 6;
this.Lat = 4;
} else if (num == 2) {
//1:50万
this.Long = 3;
this.Lat = 2;
} else if (num == 3) {
//1:25万
this.Long = 1.5;
this.Lat = 1;
} else if (num == 4) {
//1:10万
this.Long = 0.5;
this.Lat = 1 / 3;
} else if (num == 5) {
//1:5万
this.Long = 1 / 4;
this.Lat = 1 / 6;
} else if (num == 6) {
//1:2.5万
this.Long = 1 / 8;
this.Lat = 1 / 12;
} else if (num == 7) {
//1:1万
this.Long = 1 / 16;
this.Lat = 1 / 24;
} else if (num == 8) {
//1:5000
this.Long = 1 / 32;
this.Lat = 1 / 48;
} else if (num == 8) {
//1:2000
this.Long = 1 / 96;
this.Lat = 1 / 144;
} else if (num == 8) {
//1:1000
this.Long = 1 / 192;
this.Lat = 1 / 288;
} else if (num == 8) {
//1:500
this.Long = 1 / 384;
this.Lat = 1 / 576;
}
},
outPutExtent(lat0, lon0, lat1, lon1, number) {
var geom = ol.geom.Polygon.fromExtent([lon0, lat0, lon1, lat1]);
var feature = new ol.Feature({
geometry: geom,
labelPoint: new ol.geom.Point([(lat0 + lat1) / 2, (lon0 + lon1) / 2]),
name: number
});
feature.setStyle(this.createLabelStyle(feature));
var vectorLayer = getLayerByName(this.$map2d, "measureLayer");
var vectorSource = vectorLayer.getSource();
vectorSource.clear();
vectorSource.addFeature(feature);
this.$map2d.getView().fit(geom);
},
//生成样式
createLabelStyle(feature) {
return new ol.style.Style({
text: new ol.style.Text({
textAlign: "center",
textBaseLine: "middle",
font: "bold 20px 微软雅黑",
text: feature.get("name"),
fill: new ol.style.Fill({
color: "red"
}),
stoke: new ol.style.Stroke({
color: "red",
width: 2
})
}),
fill: new ol.style.Fill({
color: "rgba(255, 255, 255, 0.2)" //填充颜色
}),
stroke: new ol.style.Stroke({
color: "red", //边框颜色
width: 2 // 边框宽度
})
});
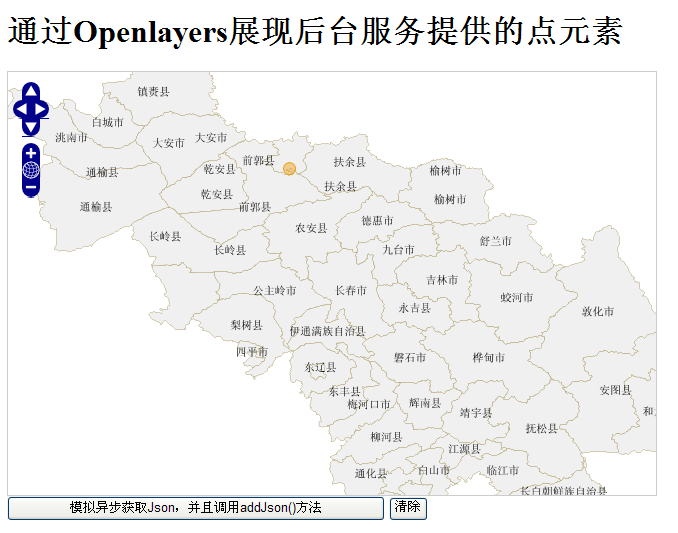
},最后的结果如下图所示:

转载自:https://blog.csdn.net/GISuuser/article/details/80921975