Openlayers3中统计图的实现:结合highcharts实现统计图
概述:
在前文中讲到了在Arcgis for js中统计图的实现,在本文,讲述在Openlayers3中结合highcharts实现统计图。
实现:
在Openlayers3中实现统计图比较方便,通过ol.Overlay即可。首先,了解下Overlay。在OL3的借口文档中,Overlay的描述如下:
An element to be displayed over the map and attached to a single map location。
大概意思就是一个有空间位置的可以在地图上展示的要素。
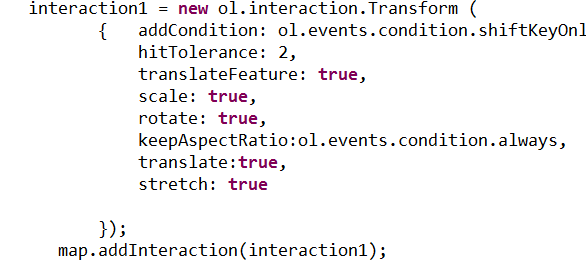
关键代码:
- $(“#addchart”).on(“click”,function(){
- for(var i=0;i<data.length;i++){
- var d = data[i];
- var pt = [d.x, d.y];
- var domid = “chart”+i;
- $(“#chart”).append(“<div id='”+domid+“‘></div>”);
- var chart = new ol.Overlay({
- position: pt,
- positioning: ol.OverlayPositioning.CENTER_CENTER,
- element: document.getElementById(domid)
- });
- map.addOverlay(chart);
- addChart(domid,d,100);
- }
- });
- function addChart(domid,data,size){
- $(‘#’+domid).highcharts({
- chart: {
- backgroundColor: ‘rgba(255, 255, 255, 0)’,
- plotBorderColor: null,
- plotBackgroundColor: null,
- plotBackgroundImage: null,
- plotBorderWidth: null,
- plotShadow: false,
- width: size,
- height: size
- },
- tooltip: {
- pointFormat: ‘<b>{point.percentage:.1f}%</b>’
- },
- credits:{
- enabled:false
- },
- title: {
- text: ”
- },
- plotOptions:{
- pie: {
- dataLabels: {
- enabled: false
- }
- }
- },
- series: [{
- type: ‘pie’,
- name: data.name,
- data: data.data
- }]
- });
- }
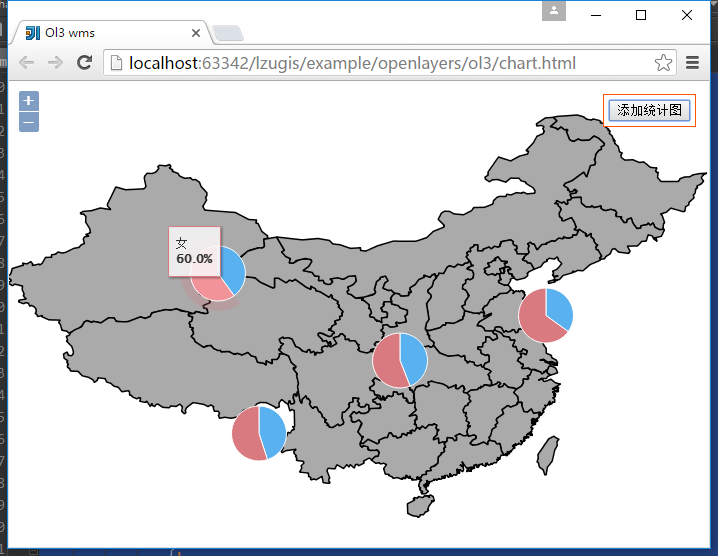
上述代码运行后的效果如下:
上述示例的完整代码如下:
[html]
view plain
copy
print?

view plain
copy
print?
- <html xmlns=“http://www.w3.org/1999/xhtml”>
- <head>
- <meta http-equiv=“Content-Type” content=“text/html; charset=utf-8” />
- <title>Ol3 wms</title>
- <link rel=“stylesheet” type=“text/css” href=“../../../plugin/ol3/css/ol.css”/>
- <style type=“text/css”>
- body, #map {
- border: 0px;
- margin: 0px;
- padding: 0px;
- width: 100%;
- height: 100%;
- font-size: 13px;
- }
- .tool{
- position: absolute;
- top:10pt;
- right: 10pt;
- padding: 5px;
- background: #fff;
- border: 1px solid #ff5500;
- z-index: 100;
- }
- </style>
- <script type=“text/javascript” src=“../../../plugin/ol3/build/ol-debug.js”></script>
- <script type=“text/javascript” src=“../../../plugin/jquery/jquery-1.8.3.js”></script>
- <script src=“../../../plugin/highcharts/highcharts.js”></script>
- <script type=“text/javascript”>
- var data = [{name:”乌鲁木齐”,x:87.5758285931,y:43.7822116460,data:[
- {
- name: ‘男’,
- y: 40.0,
- color:”#5ab1ef”
- },{
- name: ‘女’,
- y: 60.0,
- color:”#d87a80″
- }
- ]},
- {name:”拉萨”,x:91.1629975040,y:29.7104204643,data:[
- {
- name: ‘男’,
- y: 45.0,
- color:”#5ab1ef”
- },{
- name: ‘女’,
- y: 55.0,
- color:”#d87a80″
- }
- ]},
- {name:”北京”,x:116.4575803581078,y:40.04054437977018,data:[
- {
- name: ‘男’,
- y: 35.0,
- color:”#5ab1ef”
- },{
- name: ‘女’,
- y: 65.0,
- color:”#d87a80″
- }
- ]},
- {name:”兰州”,x:103.584297498,y:36.1190864503,data:[
- {
- name: ‘男’,
- y: 44.0,
- color:”#5ab1ef”
- },{
- name: ‘女’,
- y: 56.0,
- color:”#d87a80″
- }
- ]}];
- var map;
- function init(){
- var format = ‘image/png’;
- var bounds = [73.4510046356223, 18.1632471876417,
- 134.976797646506, 53.5319431522236];
- var tiled = new ol.layer.Tile({
- visible: true,
- source: new ol.source.TileWMS({
- url: ‘http://localhost:8088/geoserver/lzugis/wms’,
- params: {‘FORMAT’: format,
- ‘VERSION’: ‘1.1.1’,
- tiled: true,
- LAYERS: ‘lzugis:province’,
- STYLES: ”
- }
- })
- });
- var projection = new ol.proj.Projection({
- code: ‘EPSG:4326’,
- units: ‘degrees’
- });
- map = new ol.Map({
- controls: ol.control.defaults({
- attribution: false
- }),
- target: ‘map’,
- layers: [
- tiled
- ],
- view: new ol.View({
- projection: projection
- })
- });
- map.getView().fitExtent(bounds, map.getSize());
- var view =map.getView();
- $(“#addchart”).on(“click”,function(){
- for(var i=0;i<data.length;i++){
- var d = data[i];
- var pt = [d.x, d.y];
- var domid = “chart”+i;
- $(“#chart”).append(“<div id=‘”+domid+”‘></div>”);
- var chart = new ol.Overlay({
- position: pt,
- positioning: ol.OverlayPositioning.CENTER_CENTER,
- element: document.getElementById(domid)
- });
- map.addOverlay(chart);
- addChart(domid,d,100);
- }
- });
- }
- function addChart(domid,data,size){
- $(‘#’+domid).highcharts({
- chart: {
- backgroundColor: ‘rgba(255, 255, 255, 0)’,
- plotBorderColor: null,
- plotBackgroundColor: null,
- plotBackgroundImage: null,
- plotBorderWidth: null,
- plotShadow: false,
- width: size,
- height: size
- },
- tooltip: {
- pointFormat: ‘<b>{point.percentage:.1f}%</b>’
- },
- credits:{
- enabled:false
- },
- title: {
- text: ”
- },
- plotOptions:{
- pie: {
- dataLabels: {
- enabled: false
- }
- }
- },
- series: [{
- type: ‘pie’,
- name: data.name,
- data: data.data
- }]
- });
- }
- </script>
- </head>
- <body onLoad=“init()”>
- <div id=“map”>
- <div class=“tool”>
- <button id=“addchart”>添加统计图</button>
- </div>
- <div style=“display: none;” id=“chart”>
- </div>
- </div>
- </body>
- </html>
转载自:https://blog.csdn.net/xiaohan2826/article/details/53860010