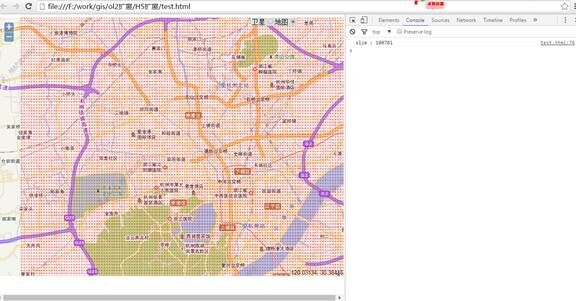
openlayers中叠加图片bounds计算小工具
不知道大家有没有遇到在OpenlayersG地图中叠加图片显示的情况,这里发布一个我用来计算图片bounds的工具代码: 转载请注明出处:tedeum.iteye.com
<!DOCTYPE html>
<html xmlns="http://www.w3.org/1999/xhtml">
<head>
<meta http-equiv="Content-Type" content="text/html; charset=utf-8"/>
<meta name="Author" content="tedeum.iteye.com">
<meta name="Description" content="openlayers叠加图片bounds计算小工具">
    <title></title>
    <script src="../jquery-1.10.1.min.js"></script>
    <script src="../openlayers/OpenLayers.js"></script>
    <style type="text/css">
        html, body, #map
        {
            background: #BADDA5;
            margin: 0;
            width: 100%;
            height: 100%;
        }
        /**
	 * Map Examples Specific
	 */
        .smallmap
        {
            width: 512px;
            height: 256px;
            border: 1px solid #ccc;
        }
    </style>
    <script type="text/javascript">

        <!--
        var bounds = new OpenLayers.Bounds(97.00558699999989, 21.00948400000005, 105.98950200000028, 30.00842);
        var graphic = new OpenLayers.Layer.Image(
            'City Lights',
            '../../FtpData/F21/201310080800.L000.F21.100.gif',
            bounds,
            new OpenLayers.Size(800, 800),
            {
                isBaseLayer: false,
                opacity: 0.3,
                alwaysInRange: true
            }
        );
        var gisUrl = "http://10.180.81.72:8080/geoserver/wms";
        var vectorLayer = null;
        var map = null;
        function doOnload() {
            map = new OpenLayers.Map({
                div: "map",
                maxExtent: [97.027587, 21.166484, 106.739502, 29.31642],
                center: new OpenLayers.LonLat(101.857909, 24.726875)
            });
            //基础地图
            var map_back = new OpenLayers.Layer.WMS("地图背景",
                gisUrl,
                { 'layers': 'sdgis:MAP_BACK', transparent: true, format: 'image/gif' },
                { isBaseLayer: true }
            );
            var map_dqj = new OpenLayers.Layer.WMS("地区界",
                gisUrl,
                { 'layers': 'sdgis:DQJ', transparent: true, format: 'image/gif' },
                { isBaseLayer: false }
            );


            map.addLayers([map_back, map_dqj, graphic]);
            map.zoomToExtent([97.027587, 21.166484, 106.739502, 27.467659], true);
        }
        function refreshLayer() {
            map.removeLayer(graphic);
            graphic = new OpenLayers.Layer.Image(
                'City Lights',
                '../../FtpData/F21/201310080800.L000.F21.100.gif',
                bounds,
                new OpenLayers.Size(800, 800),
                {
                    isBaseLayer: false,
                    opacity: 0.3,
                    alwaysInRange: true
                }
            );
            map.addLayer(graphic);
        }
        function getf() {
            return Number(document.getElementById("f").value);
        }
        function addTop() {
            bounds.top += getf();
            refreshLayer();
            showResult();
        }
        function subTop() {
            bounds.top -= getf();
            refreshLayer();
            showResult();
        }
        function addBottom() {
            bounds.bottom += getf();
            refreshLayer();
            showResult();
        }
        function subBottom() {
            bounds.bottom -= getf();
            refreshLayer();
            showResult();
        }
        function addLeft() {
            bounds.left += getf();
            refreshLayer();
            showResult();
        }
        function subLeft() {
            bounds.left -= getf();
            refreshLayer();
            showResult();
        }
        function addRight() {
            bounds.right += getf();
            refreshLayer();
            showResult();
        }
        function subRight() {
            bounds.right -= getf();
            refreshLayer();
            showResult();
        }
        function showResult() {
            document.getElementById("result").value = bounds.left + ", " + bounds.bottom + ", " + bounds.right + ", " + bounds.top;
        }
        //-->
    </script>
</head>
<body onload="doOnload();">
    <div id="map">
        <input type="text" name="" id ="f" value="0.1">
        <input type="button" value="+上" onclick="addTop();">
        <input type="button" value="-上" onclick="subTop();">
        <input type="button" value="+下" onclick="addBottom();">
        <input type="button" value="-下" onclick="subBottom();">
        <input type="button" value="+左" onclick="addLeft();">
        <input type="button" value="-左" onclick="subLeft();">
        <input type="button" value="+右" onclick="addRight();">
        <input type="button" value="-右" onclick="subRight();">
        <input type="button" value="显示结果" onclick="showResult();">
        <input type="text" name="r" id="result">
    </div>

</body>
</html>
转载请注明出处:tedeum.iteye.com
转载自:https://blog.csdn.net/sunsides/article/details/84525439


