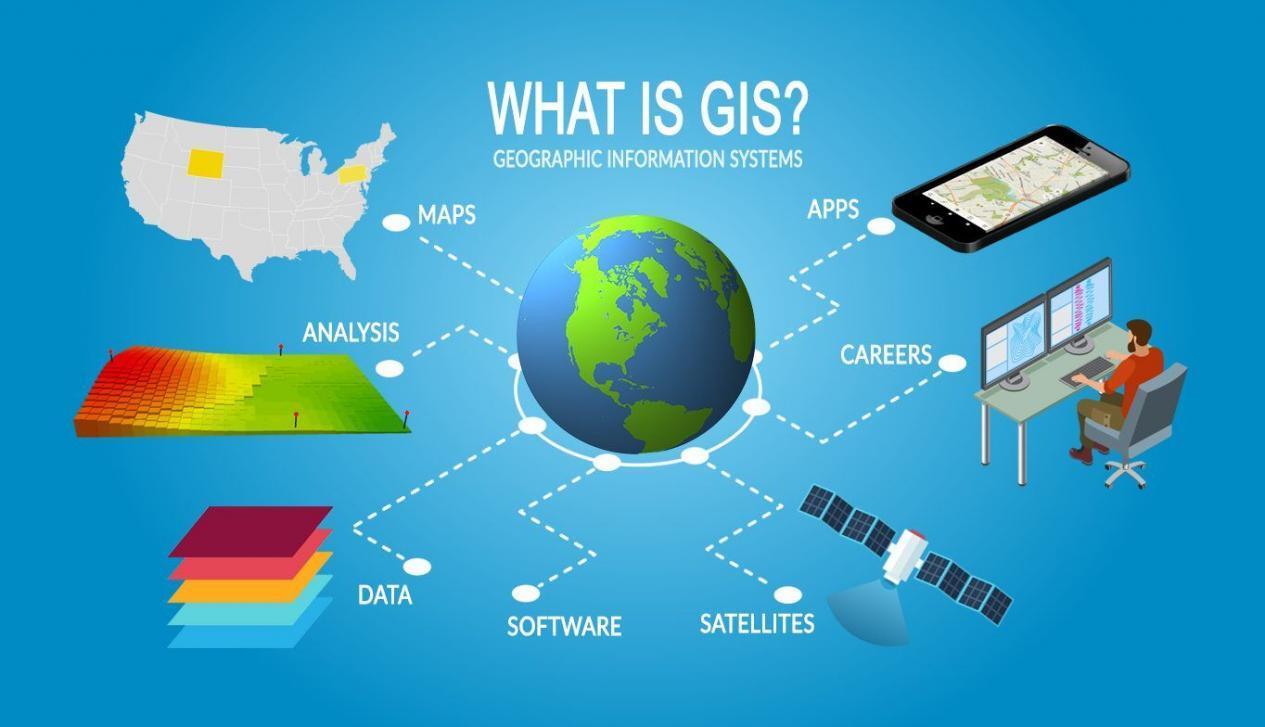
What is GIS?
Geographic Information Systems (GIS) store, analyze, and visualize data for geographic positions on Earth’s surface.
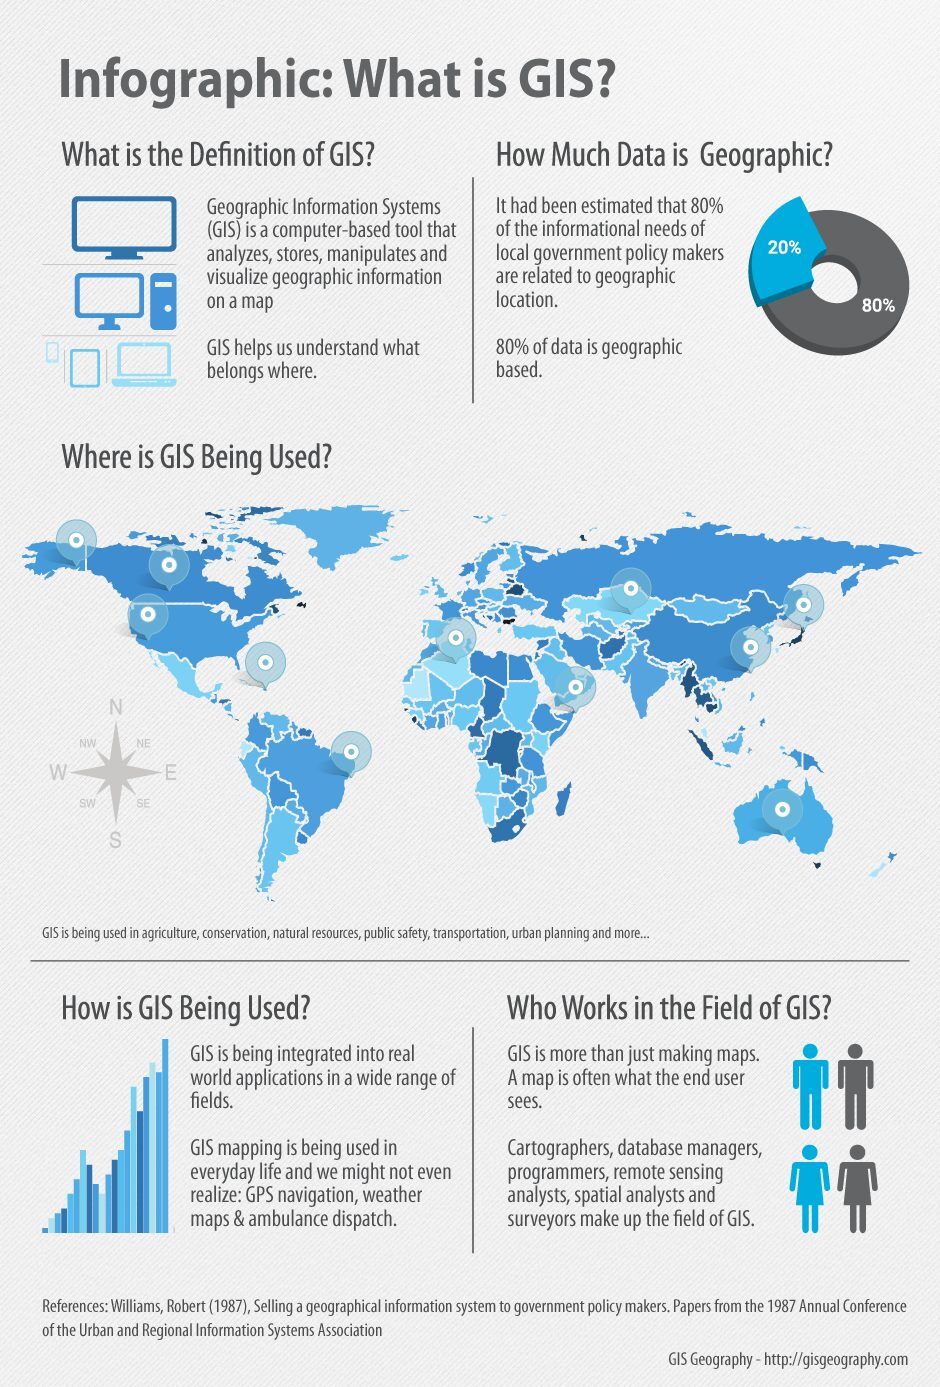
GIS stands for Geographic Information Systems and is a computer-based tool that examines spatial relationships, patterns, and trends in geography.
It was used back in 1854 (without computers of course!) to map a disease outbreak in the City of London. Fundamentally, we still use this type of spatial analysis today but in a more sophisticated way.
In a nutshell:
Data without spatial reference doesn’t provide geographic context. And without geographic context, you can’t fully understand the world that we live in today.
That’s why we need Geographic Information Systems (GIS) and how come it’s making a substantial impact in our daily lives (that you may not even notice).
READ MORE: The Power of Spatial Analysis: Patterns in Geography
What is GIS Mapping?

GIS mapping produces visualizations of geospatial information. The 4 main ideas of Geographic Information Systems (GIS) are:
Because viewing and analyzing data on maps impacts our understanding of data, we can make better decisions using GIS.
It helps us understand what is where. The analysis becomes simple. Answers become clear.
Because you don’t fully understand your data until you see how it relates to other things in a geographic context.
What are the Use Cases of GIS?
Every day, GIS powers millions of decisions around the world. It makes a big impact on our lives and you might not even realize it. For example, we use GIS for:
These 1000 GIS applications illustrate all the potential use cases of Geographic Information Systems.
How To Visualize Geography with Maps
I think you’ll agree:
It’s REALLY hard to visualize latitude and longitude coordinates from a spreadsheet.
| City | Latitude | Longitude |
|---|---|---|
| Seattle | 47.5° | -122.3° |
| New York | 40.7 | -73.9° |
| Miami | 25.8° | -80.2° |
| Los Angeles | 33.9° | -118.2° |
But when you add these positions on a map, suddenly spreadsheets come to life.
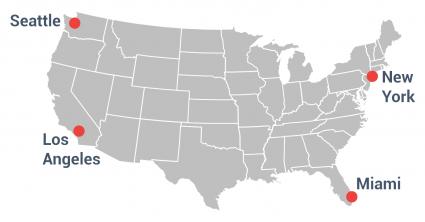
That’s because maps make geographic information easier to understand.
When you have geographic context, you don’t only see where they are on a map. But you can:
- Calculate how far points are from each other
- Check if points are clustered for patterns and trends
- Find the optimal route between cities
Components of Geographic Information Systems
The 3 main components of Geographic Information Systems are:
1. Data
GIS stores location data as thematic layers. Each data set has an attribute table that stores information about the feature. The two main types of GIS data are raster and vector:

Raster
Raster data look like grids because they store data in rows and columns. They can be discrete or continuous. For example, we often represent land cover, temperature data, and imagery as raster data.
Vector
Vectors are points, lines, and polygons with vertices. For example, fire hydrants, contours, and administrative boundaries are often vectors.
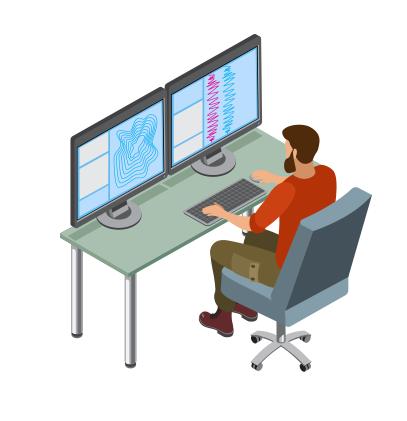
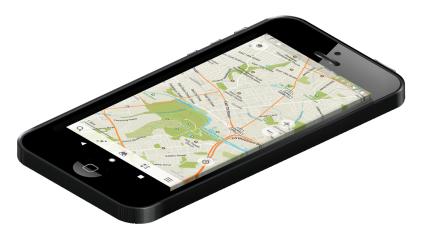
2. Hardware
Hardware runs GIS software. It could be anything from powerful servers, mobile phones, or a personal GIS workstation. The CPU is your workhorse and data processing is the name of the game. Dual monitors, extra storage, and crisp graphic processing cards are must-haves too in GIS.
3. Software
ArcGIS and QGIS are the leaders in GIS software. GIS software specializes in spatial analysis by using math in maps. It blends geography with modern technology to measure, quantify and understand our world.
Drive Decisions with Spatial Analysis
Never before have we had more pressing issues in need of a geospatial perspective. For example, climate change, natural disasters, and population are all geographic in nature. These global issues need location-based knowledge that can only come from a GIS.
Most people think GIS is only about “making maps”. But we harness the power of GIS because of the insights of spatial analysis. We use spatial analysis through math in maps. Spatial analysis is difficult with paper maps so that’s why we need GIS. Here are examples of spatial analysis:
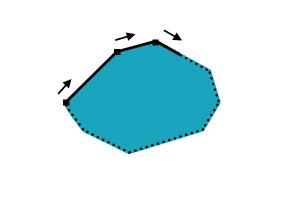
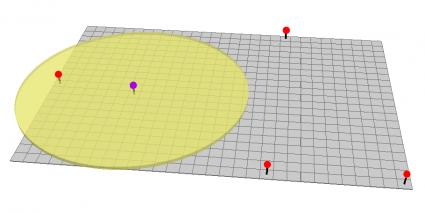
Buffer
The buffer tool generates a polygon around features at a set distance. By creating buffers, you can find the surrounding features that are within buffers.
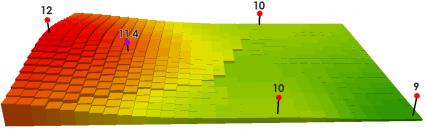
Hot Spot
Hot spots highlight areas that have clusters of points. Whereas cold spots have a small density of points.
Build Your Career in Geomatics
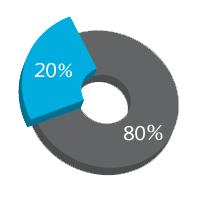
This quote means that if you take 80% of all government data, 80% has a geographic context. This quote originated from Robert Williams in his paper “Selling a geographical information system to government policymakers.”[1]
But recently, researchers have cut this percentage to 60% in 2012.[2] Either way, geography is a big component of data.
From planning a pipeline to navigating ships, spatial problems need spatial thinkers. This is why Geographic Information Systems has expanded into countless disciplines. GIS careers are booming for:
- CARTOGRAPHERS create maps. In fact, the origin of “cartographer” comes from charta which means “tablet or leaf of paper” and graph “to draw”
- DATABASE MANAGERS store and extract information from structured sets into spatial databases.
- PROGRAMMERS write code and automate redundant GIS processes. For example, GIS programming languages include Python, SQL, C++, Visual Basic, and JavaScript.
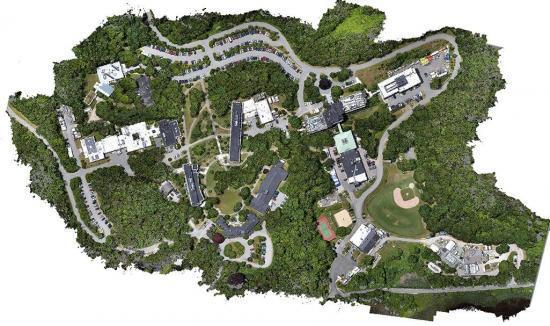
- REMOTE SENSING SPECIALISTS use aerial, satellite imagery, and remote sensing software.
- SPATIAL ANALYSTS use geoprocessing tools to manipulate, extract, locate and analyze geographic data.
- LAND SURVEYORS measure the 3-dimensional coordinates on the land.
READ MORE: GIS Salary Expectations: Climb the GIS Career Ladder
80% of the informational needs of local government are related to geographic location.
GIS All Started by Mapping Cholera
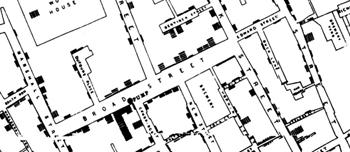
In 1854, cholera hit the city of London, England. No one knew where the disease started. So, British physician John Snow started mapping the outbreak.
It wasn’t just the disease. But he also mapped out roads, property boundaries, and water lines.
When he added these features to a map, something interesting happened. He noticed that cholera cases were only along one water line. This was a breakthrough that connected geography to public health safety. But it wasn’t only the beginning of spatial analysis. It also marked the start of epidemiology, the study of the spread of disease.
In 1968, a man by the name of Roger Tomlinson started piecing together modern computing with maps. In fact, he first coined the term “GIS” in his paper “A Geographic Information System for Regional Planning“.[3] At this moment, GIS truly became a computer-based tool for storing map data. In 2014, Roger Tomlinson later passed away and will always be remembered as the “father of GIS”.
READ MORE: The Remarkable History of GIS

“Great discoveries and improvements invariably involve the cooperation of many minds. I may be given credit for having blaze the trail of GIS. But when I look at the subsequent development, I feel the credit is due to others rather than just myself.”
— Roger Tomlinson, The Father of GIS
GIS Uses and Applications
Geographic Information Systems is jam-packed with example use cases. For example, we’ve found over 1000 GIS uses and applications. Here are some examples below.
ENVIRONMENT: By far, the heaviest users are for the environment. For example, conservationists use GIS for climate change, groundwater studies, and impact assessments.
MILITARY AND DEFENSE: The military is a heavy user of GIS. They use it for location intelligence, logistics management, and spy satellites.
AGRICULTURE: Farmers use it for precision farming, soil mapping, and crop productivity.
FORESTRY: Foresters manage timber, track deforestation, and inventory forest stands with GIS.
BUSINESS: More on the business side of things, GIS is for site selection, consumer profiling, and customer prospecting.
REAL ESTATE: Examples in real estate include market analysis, home valuations, and zoning.
PUBLIC SAFETY: GIS shows the spread of disease, disaster response, and public health.
What Can GIS Do For You?
Geographic Information Systems better answer questions about location, patterns, and trends. For example:
1. Where are the land features found? If you need to find the closest gas station, GIS can show you the way. GIS can find optimal locations by connecting traffic volumes, zoning information, and demographics.
2. What geographical patterns exist? In conservation, we want to know animal habitats using GPS collars and land cover. By knowing animal locations, we can correlate preferred land types with GPS locations. In the end, we have a massive database with all types of species of animals.
3. What changes have occurred over a given period of time? Time is the missing element in studying change. For example, we understand change through remote sensing of the environment. Also, we better predict disasters by finding changes over time.
4. What are the spatial implications? If a company wants to build a new project, GIS excels in storing environment data. Most environmental assessments use GIS to understand the impact of projects on the landscape.
What is Geographic Information Science (GISc)?
While Geographic Information Systems answers “what” and “where”, Geographic Information Science (GIScience) is concerned with the “how” and its development.
How will GIS grow in the upcoming years? This is a question that Geographic Information Science understands best.
Geographic Information Science provides all the building blocks for Geographic Information Systems. It draws from computer science, mathematics, geography, statistics, cartography, and geodesy.
GIScience incorporates the knowledge from these fields into Geographical Information Systems.
- Geographic Information Systems connects what with the where.
- Geographic Information Science discovers how.
What are Geographic Information Systems?
You might ask yourself: Haven’t geographers been answering these questions for centuries? Yes, they have. But geographers can answer these questions much better with Geographic Information Systems.
When we first started recording inventories on paper maps, it was quite a tedious process. But what did we really need? We needed a GIS to record and store observations. Also, we needed a table to store the attributes of the data.
What’s the bottom line? Geographic information systems (GIS) let us interpret data understanding relationships, patterns, and trends. Then, viewing and analyzing data geographically impacts our understanding of our world.
- What is Geofencing?
- What is Remote Sensing? The Definitive Guide
- What is the Difference Between Geomatics and GIS?
References
1. Williams, Robert (1987), Selling a geographical information system to government policymakers. Papers from the 1987 Annual Conference of the Urban and Regional Information Systems Association.
2. Stefan Hahmann & Dirk Burghardt. How much information is geospatially referenced? Networks and cognition (Pages 1171-1189). Received 27 Jun 2012, Accepted 21 Oct 2012, Published online: 23 Nov 2012.
3. R. F. Tomlinson. A Geographic Information System for Regional Planning. Department of Forestry and Rural Development. Government of Canada, Published 1969.