deck.gl渲染ContourLayer等值线图层
目录
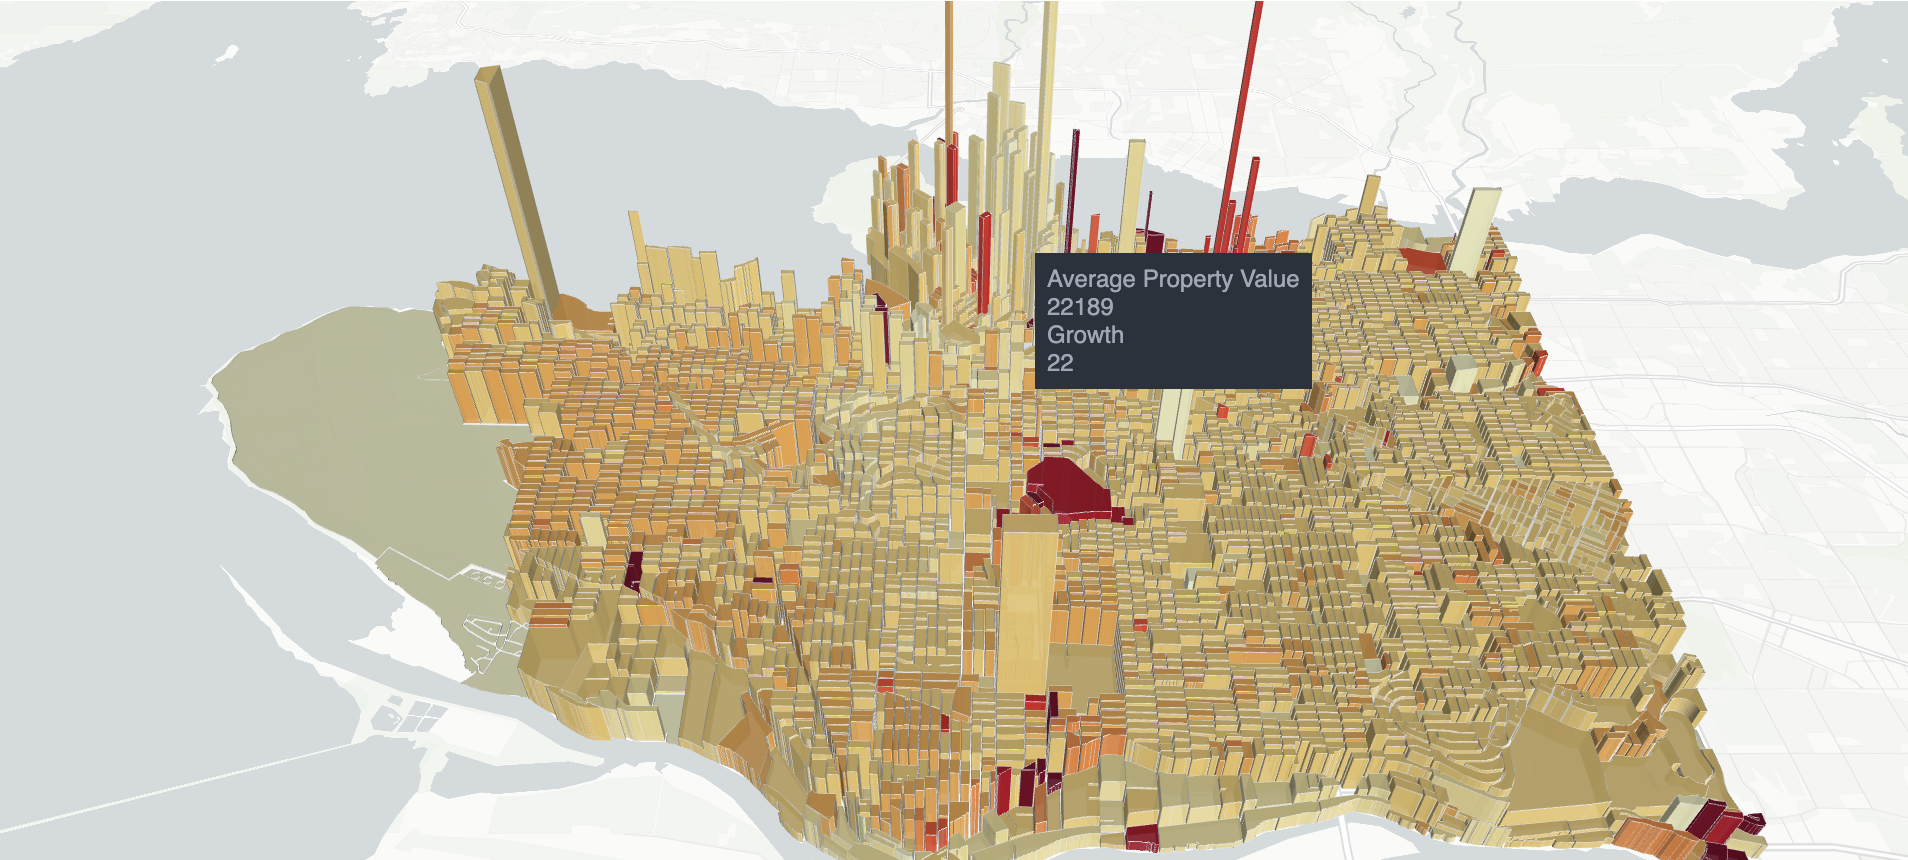
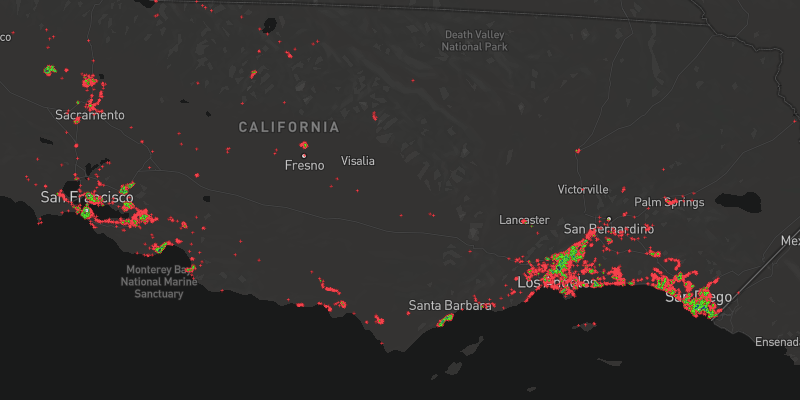
效果图
在线地址
deck.gl渲染ContourLayer等值线图层
在线如果数据加载慢,是由于数据文件存储在github上,可以稍等一会,或者可以开启vpn
功能说明
本实例实现了deck.gl加载底图,使用ContourLayer加载海量点数据并根据规则进行插值,渲染成等值线。
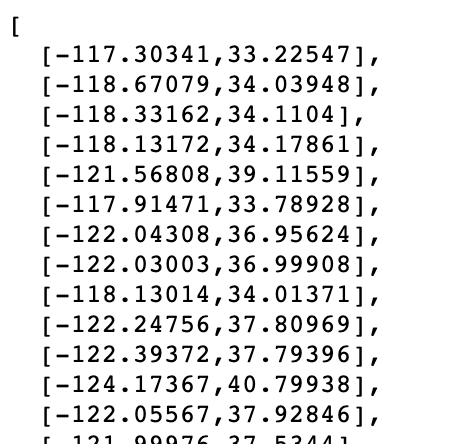
数据格式
代码解析
- 此部分是引入在线deck.gl包,因为要用到mapboxgl的底图数据,同时引入了mapboxgl包;设置了基本的css样式
 <html>
  <head>
    <title>deck.gl ContourLayer Example</title>

    <script src="https://unpkg.com/deck.gl@^8.8.0/dist.min.js"></script>

    <script src="https://api.tiles.mapbox.com/mapbox-gl-js/v1.13.0/mapbox-gl.js"></script>

    <style type="text/css">
      body {
        width: 100vw;
        height: 100vh;
        margin: 0;
      }
    </style>
</head>- 这部分是es6写法,引入需要的模块DeckGL、ContourLayer,并初始化DeckGL(GeoJsonLayer已经有过解释可参照deck.gl渲染GeoJsonLayer)
初始化ContourLayer图层,详细配置说明见注释
   <script type="text/javascript">
    const {DeckGL, ContourLayer} = deck;

    new DeckGL({
      mapStyle: 'https://basemaps.cartocdn.com/gl/dark-matter-nolabels-gl-style/style.json',
      initialViewState: {
        longitude: -119.3,
        latitude: 35.6,
        zoom: 6,
        maxZoom: 20
      },
      controller: true,
      layers: [
        new ContourLayer({
          id: 'contourLayer',// 图层唯一id
          data:
            'https://raw.githubusercontent.com/visgl/deck.gl-data/master/examples/screen-grid/ca-transit-stops.json', // 数据源
          getPosition: d => d, // 解析数据获取位置点
                    // getWeight:d=>d[2], //如果数据有权重值可以设置此选项,会根据权重值进行判定
          contours: [// 指定等值线渲染规则 有两种方式一种直接设置一个值threshold: 1,一种设置范围threshold: [6, 10]
            {threshold: 1, color: [255, 0, 0], strokeWidth: 4},
            {threshold: 5, color: [0, 255, 0], strokeWidth: 2},
            {threshold: [6, 10], color: [0, 0, 255, 128]}
          ]
        })
      ]
    });
  </script>
源代码
拷贝到html文件中可直接用浏览器打开
<html>
  <head>
    <title>deck.gl ContourLayer Example</title>

    <script src="https://unpkg.com/deck.gl@^8.8.0/dist.min.js"></script>

    <script src="https://api.tiles.mapbox.com/mapbox-gl-js/v1.13.0/mapbox-gl.js"></script>

    <style type="text/css">
      body {
        width: 100vw;
        height: 100vh;
        margin: 0;
      }
    </style>
  </head>

  <body></body>

  <script type="text/javascript">
    const {DeckGL, ContourLayer} = deck;

    new DeckGL({
      mapStyle: 'https://basemaps.cartocdn.com/gl/dark-matter-nolabels-gl-style/style.json',
      initialViewState: {
        longitude: -119.3,
        latitude: 35.6,
        zoom: 6,
        maxZoom: 20
      },
      controller: true,
      layers: [
        new ContourLayer({
          id: 'contourLayer',
          data:
            'https://raw.githubusercontent.com/visgl/deck.gl-data/master/examples/screen-grid/ca-transit-stops.json',
          getPosition: d => d,
          contours: [
            {threshold: 1, color: [255, 0, 0], strokeWidth: 4},
            {threshold: 5, color: [0, 255, 0], strokeWidth: 2},
            {threshold: [6, 10], color: [0, 0, 255, 128]}
          ]
        })
      ]
    });
  </script>
</html>