在Leaflet地图上集成Echarts
目录
需求背景:
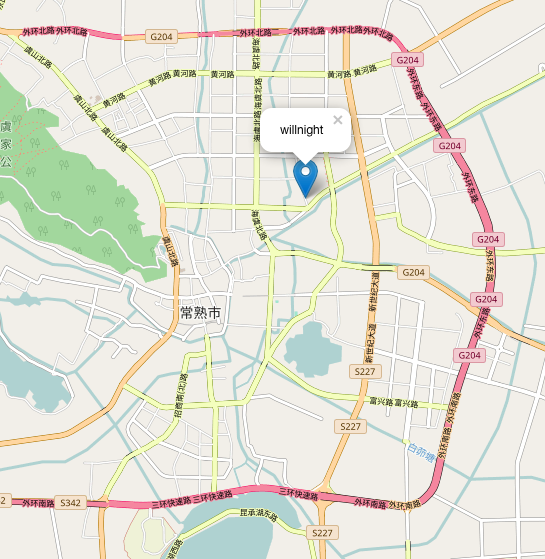
现在我要在地图上加上Echarts的散点图还有线集,看起来就很牛B的那种。上效果图:

需求分析:
我先看了看Echarts官网上有提供加载地图的例子,主要包括三种方式:
1.加载js格式的地图文件;
2.加载json格式的地图文件;
3.通过配置项bmap,就是百度地图; 参考地址:https://blog.csdn.net/wml00000/article/details/84566180
上面的我是用不了的,我用的是Leaflet地图框架,找了找已经有人实现了扩展(Echarts-Leaflet扩展地址在这:https://github.com/gnijuohz/echarts-leaflet),他是模仿着Echarts里面的bmap扩展了一个配置项leaflet,给我的感觉是在Echarts上集成了Leaflet,当然用是没有问题的,就是觉得有点别扭,我想要的是Leaflet上集成Echarts,是以Leaflet为主,所以就放弃了这种方式。个人来讲,如果不是项目原因,还是比较推荐他的扩展的。
另外,还找到一个插件leaflet-echarts3(https://github.com/wandergis/leaflet-echarts3),这个是基于Leaflet进行扩展的,但是作者没有公布源代码,只有一个压缩后的js文件,里面同时包含了leaflet源码、Echarts源码以及扩展代码,这样我想进行版本升级都不行。所以我就悄悄地把他里面的核心代码抽了出来。
具体操作:
1.下载最新Echarts源代码,http://echarts.baidu.com/download.html 下最大的那个2.86MB;
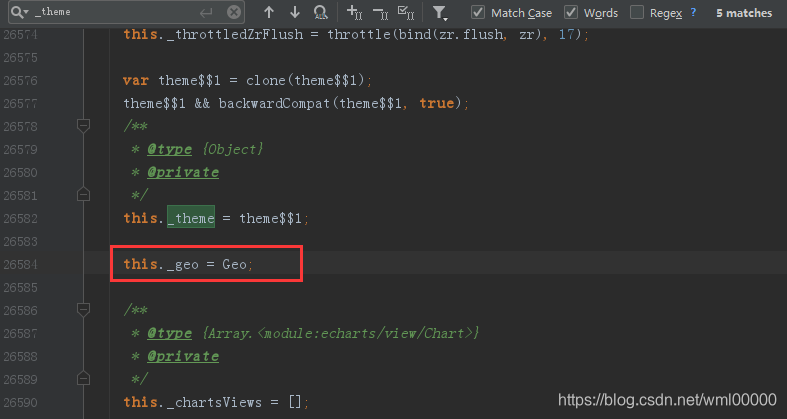
2.通过 _theme进行定位,定位到function Echarts(){ }里面的 this._theme = theme$$1; 4.2.0版本大概在第26582行,添加一行代码: this._geo = Geo;
3.对Leaflet Layer 类进行扩展,新建js文件 leaflet-echarts.js, 加入下面代码:
L.OverlayEcharts = (L.version < "1.0" ? L.Class : L.Layer).extend({
  includes: L.version < "1.0" ? L.Mixin.Events : [],
  _echartsContainer: null,
  _map: null,
  _echart: null,
  _echartsOption: null,
  initialize: function(echartsOption) {
    this._echartsOption = echartsOption;
  },
  onAdd: function(map) {
    this._map = map;
    this._initEchartsContainer();
    map.on("moveend", this._redraw, this);//当地图中心改变后触发
    this._redraw();
  },
  onRemove: function(map) {
    this._echartsContainer && map.getPanes().overlayPane.removeChild(this._echartsContainer);
    this._echart.dispose();
    map.off("moveend", this._redraw, this);
  },
  // addTo: function(map) {
  //   console.log(this);
  //   return map.addLayer(this),
  //     this
  // },
  _initEchartsContainer: function() {
    var size = this._map.getSize(),
        echartsContainer = document.createElement("div");
    console.log("=====>mapsize"+size);
    echartsContainer.style.position = "absolute";
    echartsContainer.style.height = size.y + "px";
    echartsContainer.style.width = size.x + "px";
    echartsContainer.style.zIndex = 999;
    this._echartsContainer = echartsContainer;
    this._map.getPanes().overlayPane.appendChild(this._echartsContainer);//在map容器的overlayPane上叠加Echarts容器
  },
  _resetCanvasPosition: function() {
    var bound = this._map.getBounds(),
      origin = this._map.latLngToLayerPoint(bound.getNorthWest());
    console.log(origin);//最开始为[0,0],缩放不会改变,平移会改变\
    L.DomUtil.setPosition(this._echartsContainer, origin);//设置Echarts容器的位置,以便与当前地图匹配
  },
  _redraw: function() {
    return this._resetCanvasPosition(),
      this._echartsContainer.innerHTML = "",
      this.initECharts(),
      this.setOption(this._echartsOption),
      this
  },
  clear: function() {
    this._echartsContainer.innerHTML = "",
      this.echartsOption = {}
  },
  redraw: function() {
    console.log("=======>redraw");
    this._redraw();
  },
  initECharts: function(){
    if(this._echart === null || this._echart === undefined){
      this._initECharts();
    }else {
      this._echart.dispose();
      this._initECharts();
    }
  },
  _initECharts: function() {
    if (this._echart = echarts.init(this._echartsContainer),
    "3.0" <= echarts.version) {
      var me = this;
      console.log(echarts.version);
      console.log(me._echart);
      me._echart._geo.prototype.dataToPoint = function(lnglat) {
        //重写Echarts内部方法,Ecahrts内部有一套将经纬度转为像素坐标的方法,这里要换成与Leaflet相匹配的
        var latlng = new L.latLng(lnglat[1],lnglat[0])
          , pixel = me._map.latLngToContainerPoint(latlng);
        return [pixel.x, pixel.y];  //给定地理坐标,返回相对于地图container容器的相应像素坐标。
      }
    }
    this._unbindEvent();//屏蔽Echarts相关事件
  },
  setOption: function(echartsOption) {
    if (echartsOption.series) {
      //var series = echartsOption.series || {};
      this._echart.setOption(echartsOption);
    }
  },
  _unbindEvent: function() {
    echarts.version < "3.0" ? (this._echart.getZrender().un("dragstart", function() {}),
      this._echart.getZrender().un("dragend", function() {}),
      this._echart.getZrender().un("mouseup", function() {}),
      this._echart.getZrender().un("mousedown", function() {}),
      this._echart.getZrender().un("mousewheel", function() {})) : (this._echart.getZr().off("dragstart", function() {}),
      this._echart.getZr().off("dragend", function() {}),
      this._echart.getZr().off("mouseup", function() {}),
      this._echart.getZr().off("mousedown", function() {}),
      this._echart.getZr().off("mousewheel", function() {}))
  }
}),
  L.overlayEcharts = function(options) {
    return new L.OverlayEcharts(options)
}
4. 新建html页面,代码太多,就不全放了,源文件下载地址:https://download.csdn.net/download/wml00000/10837134
<script src="lib/leaflet/leaflet.js"></script>
<script src="lib/echarts.js"></script>
<script src="lib/leaflet/leaflet-echarts.js"></script>

<div id="map"></div>
<script>
  var map = L.map('map');

 L.tileLayer('http://map.geoq.cn/ArcGIS/rest/services/ChinaOnlineStreetPurplishBlue/MapServer/tile/{z}/{y}/{x}').addTo(map);
  map.setView(L.latLng(37.550339, 104.114129), 4);  //设置缩放级别及中心点
  //Echarts相关options配置
  var option = {};
  //将Echarts加到地图上,可以简单理解为在地图上添加了Echarts图层
  L.overlayEcharts(option).addTo(map);
详细解读:
如果只是照着流程来一遍,我认为是没有灵魂的。说一说到底是如何把Echarts集成进去的。要想深入了解,需要知道Leaflet底层的一些东西,以下内容均为个人理解,请选择性阅读。
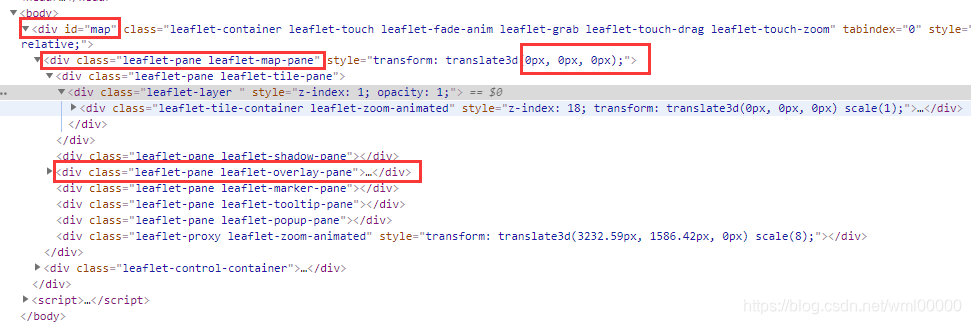
这是最开始加载Leaflet地图的一个DOM结构,我们只是创建了一个id为map的DIV,但是Leaflet内部在我们的DIV里面又创建了众多div,分为两部分:map-pane和control-container。主要看map-pane,在这个map-pane里面有tile-pane、overlay-pane等,通过这大概能看出Leaflet是通过DIV的设置实现图层、marker、覆盖物等之间的叠加,那么他又是如何根据地理坐标确定在屏幕上的位置关系的?
可以先参考一下Leaflet的介绍:https://leafletjs.com/examples/extending/extending-2-layers.html
核心内容:
- The
L.Mapcontainer has “map panes”, which are<div>s. L.Layers are HTML elements inside a map pane- The map transforms all
LatLngs to coordinates in the map’s CRS, and from that into absolute “pixel coordinates” (the origin of the CRS is the same as the origin of the pixel coordinates) - When the
L.Mapis ready (has a centerLatLngand a zoom level), the absolute pixel coordinates of the top-left corner become the “pixel origin” - Each
L.Layeris offset from its map pane according to the pixel origin and the absolute pixel coordinates of the layer’sLatLngs - The pixel origin is reset after each
zoomendorviewresetevent on theL.Map, and everyL.Layerhas to recalculate its position (if needed) - The pixel origin is not reset when panning the map around; instead, the whole panes are repositioned.
翻译一下:
- 地图容器里面有个map-pane,里面有很多的div
- 图层其实就是map-pane里面的html 元素
- 地图把经纬度转换成投影坐标系统下的坐标,再转成绝对像素坐标(投影坐标系统原点与像素坐标系原点重合)
- 当地图就绪时(中心点以及缩放级别都已经确定了),左上角的绝对像素坐标就是所谓的像素原点(注意这里加了引号,他的像素坐标不一定是0,0)
- 每个图层会根据像素原点以及图层上的经纬度坐标转换过来的绝对像素坐标在map-pane上进行偏移
- 每次缩放或视图重置坐标原点也会重置(可以简单理解为地图的重新加载,就是第4条),各个图层也得重新计算位置(因为一缩放,虽然地理坐标不变,实际上不同缩放级别地理坐标对应的像素坐标是不一样的)
- 当地图平移时像素原点不会重置(实际上当地图平移时,map-pane这个div样式中的transform变了,也就是说map-pane的左上角这个像素原点也走了,但是他的像素坐标不变,注意坐标不一定是0,0),这个map-pane上面的其他div也就跟着动了
对照着这个例子https://leafletjs.com/examples/extending/pixelorigin.html 应该能看个差不多。
再插两句:上面说到的绝对像素坐标是针对地图切片谈的,并不是针对设备坐标。每张地图切片的大小是256*256,当缩放级别为0时,就是用一张图片表示全球,绝对像素坐标原点(0,0)值位于图片左上角,换算成经纬度大约是(-180,85).另外一点,网络地图大都采用网络墨卡托投影,他并不是指投影坐标系,只是一种映射关系,是把球面地理坐标转为平面坐标的一个过程。附个地址:https://blog.csdn.net/wml00000/article/details/85014021
Echarts的散点图其实也是在一个Div上画的,只要把这个div给拿到map-pane里面的overlay-pane里面不就完事了。关于点的位置,因为Echarts内部自己有个把地理坐标转为像素坐标的方法,咱不能用他的,想办法给他重写了,用Leaflet 的latLngToContainerPoint( )代替。
关于Echarts的DIV容器怎么搞,有几点:
1.大小需要与map container匹配
2.每次平移,缩放,要重新加载Echarts(可以根据leaflet的moveend监听)
3.重写Echarts内部方法 dataToPoint
写的有点乱了
今天突然发现超图 supermap iclient 9d for Leaflet有Echarts的例子,可以看看:http://iclient.supermap.io/examples/leaflet/examples.html#viz-ECharts
转载自:https://blog.csdn.net/wml00000/article/details/84871595