Influxdb+collectd+grafana搭建现代化监控系统
在此采用centos+Influxdb+collectd+grafana搭建监控系统,特此说明下influxdb的0.9,0.10,0.11,0.12均不支持delect功能,0.8和0.13支持delect功能,其实最主要的区别是0.9版本和0.10版本,0.10更改了数据存储引擎,能够节省大量空间,查询速度也快了很多,所以第一次安装的话最好优先选择0.10及以上版本,在此,个人采用0.13。
第一步安装centos7 ,在此不描述。
第二步安装influxdb:
# cat <<EOF | sudo tee /etc/yum.repos.d/influxdb.repo
[influxdb]
name = InfluxDB Repository - RHEL \$releasever
baseurl = https://repos.influxdata.com/rhel/\$releasever/\$basearch/stable
enabled = 1
gpgcheck = 1
gpgkey = https://repos.influxdata.com/influxdb.key
EOF
# yum install -y influxdb# mkdir -p /home/influxdb/data
# chown -R influxdb:influxdb /home/influxdb以上两条命令创建的目录是用来存储influxdb的数据。个人建议,将influxdb的数据放在最大的分区内,collectd默认安装后每10秒生成一组数据,数据量还是蛮大的。
修改配置文件:
# cat /etc/influxdb/influxdb.conf
[data]
  # Controls if this node holds time series data shards in the cluster
  enabled = true

  dir = "/home/influxdb/data"
然后启动influxdb:
# service influxdb start
# service influxdb status
第三步安装collectd:
# yum install epel-release -y
# yum install -y collectd
# cat /etc/collectd.conf
Hostname    "localhost"
TypesDB     "/usr/share/collectd/types.db"
LoadPlugin network
<Plugin network>
        Server "172.16.17.129" "25826"
</Plugin>
启动collectd:
# service collectd start
# service collectd status
第四步安装grafana:
grafana依赖fontconfig
# yum -y install fontconfig
# wget https://grafanarel.s3.amazonaws.com/builds/grafana-3.1.1-1470047149.x86_64.rpm
# rpm -ivh grafana-3.1.1-1470047149.x86_64.rpm
# service grafana-server start
# service grafana-server status
启动grafana后,修改下influxdb的配置文件,以便influxdb和collectd联通:
# cat /etc/influxdb/influxdb.conf
[[collectd]]
  enabled = true
# service influxdb restart
# service influxdb status
可通过以下步骤检验collectd是否将数据存储在influxdb中:
# influx
> show databases;
name: databases
---------------
name
collectd
_nternal

> use collectd;
Using database collectd
> show MEASUREMENTS
name: measurements
------------------
name
cpu_value
interface_rx
interface_tx
load_longterm
load_midterm
load_shortterm
memory_value
> select * from cpu_value limit 10;
name: cpu_value
---------------
time            host        instance    type    type_instance   value
1469886342535694000 localhost   0       cpu user        241563
1469886342535705000 localhost   0       cpu system      63684
1469886342535709000 localhost   0       cpu wait        58022
1469886342535713000 localhost   0       cpu nice        23
1469886342535717000 localhost   0       cpu interrupt   0
1469886342535721000 localhost   0       cpu softirq     17027
1469886342535722000 localhost   0       cpu steal       0
1469886342535723000 localhost   0       cpu idle        4.461107e+06
1469886352534453000 localhost   0       cpu user        241593
1469886352534462000 localhost   0       cpu system      63693
通过如上步骤,可见influxdb和collectd已相连接。
下一步grafana和influxdb相连。
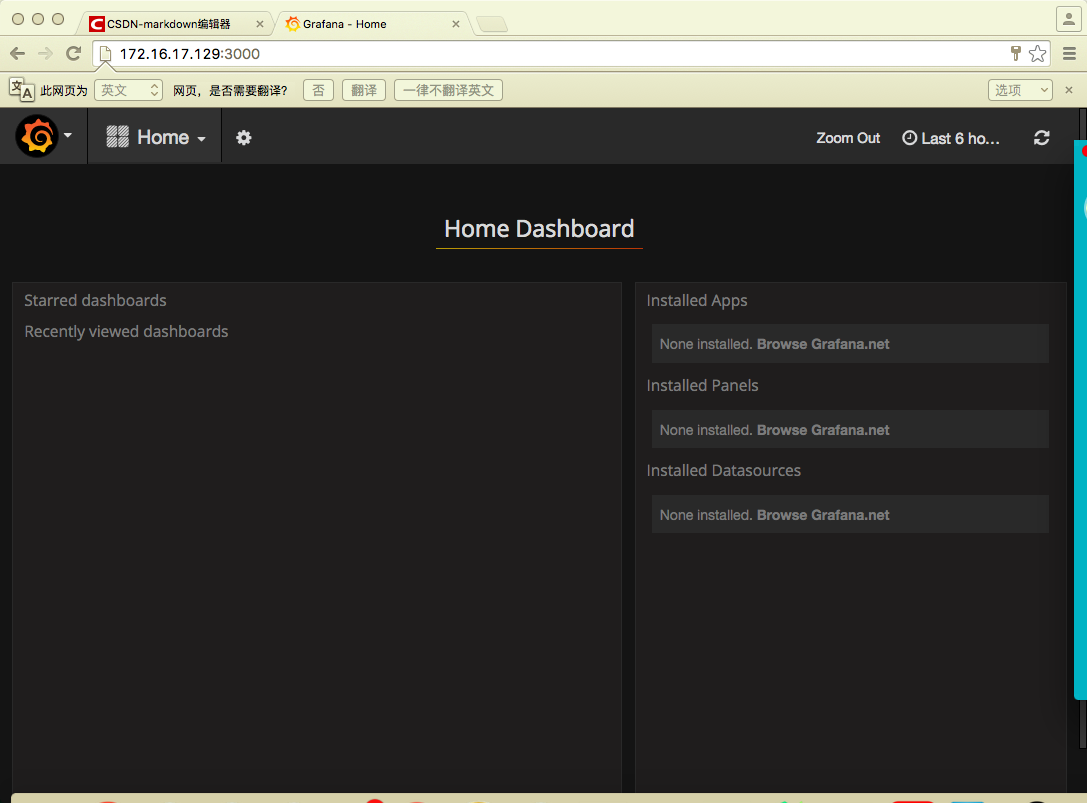
grafana的端口号是3000,打开web界面:http://172.16.17.129:3000 ,默认账户,密码为admin/admin。登陆后界面如下:
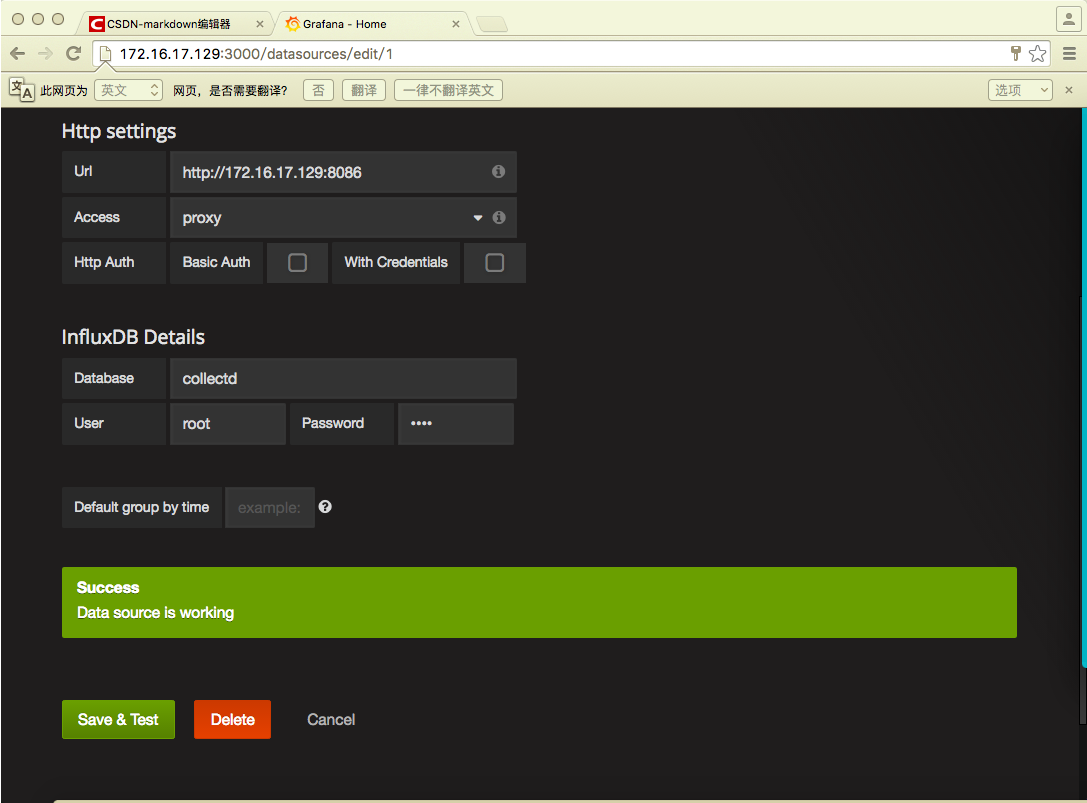
需要对influxdb连通,进行相关配置:
打开data source:

填写结果如下所示,密码账号分别为root,root:
目前基本安装已完成。
转载自:https://blog.csdn.net/qq_27078095/article/details/52088423