OpenLayers 3.0+highcharts
感谢OpenLayers中文网的fengl同学,下面是v3.0.0-gamma.2+Highcharts-4.0.3实现的地图上显示图表,具体思路如下:
(1)添加放置饼图的标签:
<div style=”display: none;”>
<div id=’canvasDiv’ ></div>
</div>
(2)用OL3加载自己的(或者网上的)地图服务:
var map = new ol.Map({
target: ‘map’,
layers: [
new ol.layer.Image({
source: new ol.source.ImageWMS({
url: ‘http://127.0.0.1:8080/geoserver/wms’,
params: {‘LAYERS’: ‘KunMing:kunming’},
serverType: ‘geoserver’,
extent: [11372895.62052765, 2715571.0055346773, 11542419.119497266, 328626540878.7492]
})
}) ],
view: new ol.View({
center: ol.proj.transform([104.73961, 25.05655], ‘EPSG:4326’, ‘EPSG:3857’),//引号附近不能有空格
zoom: 8
})
});
(3)构建饼图:
var pie = new ol.Overlay({
position: pos1,
// positioning: ol.OverlayPositioning.CENTER_CENTER,
element: document.getElementById(‘canvasDiv’)
});
(4)添加饼图到map对象:
map.addOverlay(pie);
(5)饼图的内容:
$(function () {
$(‘#canvasDiv’).highcharts({
chart: {
backgroundColor: ‘rgba(255, 255, 255, 0)’,
plotBorderColor: null,
plotBackgroundColor: null,
plotBackgroundImage: null,
plotBorderWidth: null,
plotShadow: false,
width: 200,
height: 200,
},
tooltip: {
pointFormat: ‘{series.name}: <b>{point.percentage:.1f}%</b>’
},
plotOptions: {
pie1: {
allowPointSelect: true,
cursor: ‘pointer’
}
},
title: {
text: ”
},
dataLabels: {
enabled: false,
color: ‘#000000’,
//distance: -20,
connectorColor: ‘#000000’,
formatter: function() {
return ‘<b>’+ this.point.name +'</b>: ‘+ this.percentage +’ %’;
}
},
series: [{
type: ‘pie’,
name: ‘学历百分比:’,
data: [
[‘高中’, 15.0],
[‘专科’, 26.8],
{
name: ‘本科’,
y: 42.8,
sliced: true,
selected: true
},
[‘硕士’, 8.5],
[‘博士’, 6.2],
[‘其他’, 0.7]
]
}]
});
});
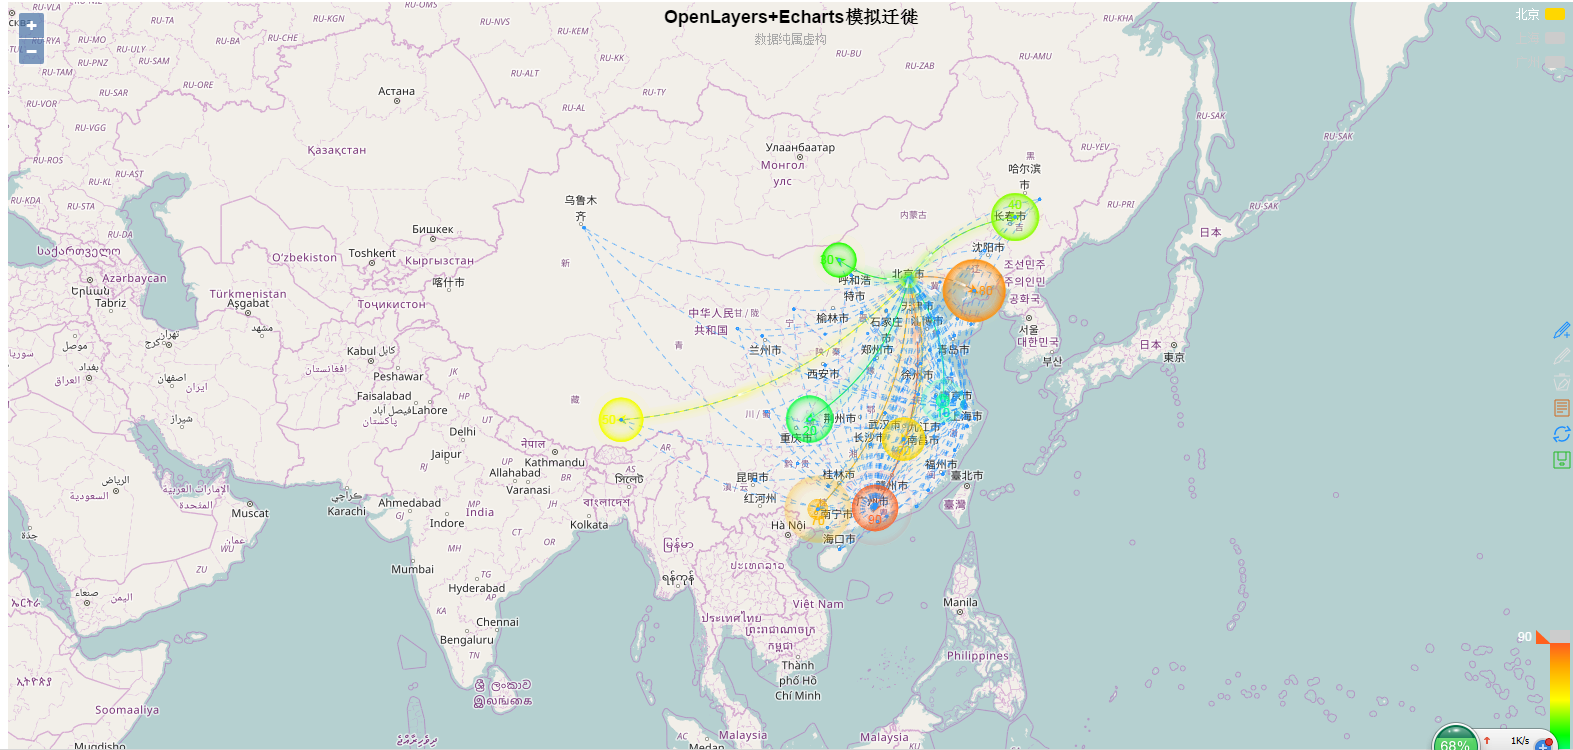
最终效果:

转载自:https://blog.csdn.net/u011135103/article/details/38091135