Leaflet各种实战实例
目录
Leaflet移动端全屏地图
在本例中,您将学习如何创建针对iPhone,iPad或Android手机等移动设备调整的全屏地图,以及如何轻松检测并使用当前用户位置。
准备页面
首先我们来看一下页面的HTML和CSS代码。为了使我们的地图div元素延伸到所有可用空间(全屏),我们可以使用下面的CSS代码(注意:在这个例子中,我们使用百分比来表示高度。虽然由于谷歌浏览器在手机上的错误,vh可以说更好。 :
body {

    padding: 0;

    margin: 0;

}html, body, #map {

    height: 100%;

    width: 100vw;

}
此外,我们需要告诉移动浏览器禁用不必要的页面缩放,并通过在headHTML部分或HTML页面中放置以下行来将其设置为实际大小:
<meta name="viewport" content="width=device-width, initial-scale=1.0, maximum-scale=1.0, user-scalable=no" />
初始化地图
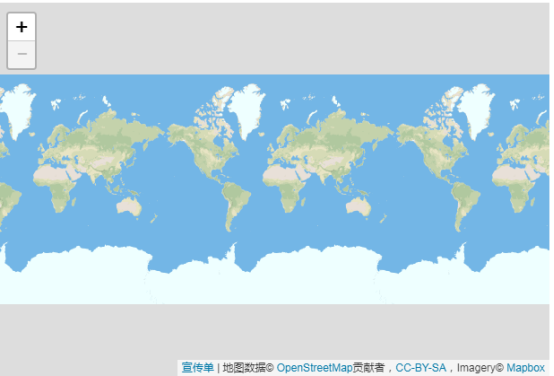
现在我们将使用JavaScript代码初始化地图,就像我们在快速入门指南中所做的一样,展示整个世界:
var map = L.map('map').fitWorld();

L.tileLayer('https://api.tiles.mapbox.com/v4/MapID/997/256/{z}/{x}/{y}.png?access_token={accessToken}', {

    attribution: 'Map data © <a href="https://www.openstreetmap.org/">OpenStreetMap</a> contributors, <a href="https://creativecommons.org/licenses/by-sa/2.0/">CC-BY-SA</a>, Imagery © <a href="https://www.mapbox.com/">Mapbox</a>',

    maxZoom: 18

}).addTo(map);
地理位置
Leaflet有一个非常方便的快捷方式,用于将地图视图缩放到检测到的位置 – locate使用该setView选项的方法,替换setView代码中的常用方法:
map.locate({setView: true, maxZoom: 16});
在自动设置地图视图时,我们在此指定16作为最大缩放。只要用户同意共享位置并且浏览器检测到该位置,地图就会将视图设置为该位置。现在我们有一个工作的全屏移动地图!但是如果我们在地理定位完成后需要做些什么呢?下面介绍一下locationfound和locationerror事件的。举个例子,在检测到的位置添加一个标记,通过locationfound在locateAndSetView调用之前向事件添加一个事件监听器来显示弹出窗口中的准确性:
function onLocationFound(e) {

    var radius = e.accuracy / 2;

    L.marker(e.latlng).addTo(map)

        .bindPopup("You are within " + radius + " meters from this point").openPopup();

    L.circle(e.latlng, radius).addTo(map);

}

map.on('locationfound', onLocationFound);
优秀!但是,如果地理位置失败,则显示错误消息也会很好:
function onLocationError(e) {

    alert(e.message);

}
map.on(‘locationerror’, onLocationError);
如果您将setView选项设置为true并且地理位置失败,则会将视图设置为全局。
完整例子
<!DOCTYPE html>
<html>
<head>
<title>Mobile tutorial - Leaflet</title>
<meta charset="utf-8" />
<meta name="viewport" content="width=device-width, initial-scale=1.0">
<link rel="shortcut icon" type="image/x-icon" href="docs/images/favicon.ico" />
<link rel="stylesheet" href="https://unpkg.com/leaflet@1.3.1/dist/leaflet.css" integrity="sha512-Rksm5RenBEKSKFjgI3a41vrjkw4EVPlJ3+OiI65vTjIdo9brlAacEuKOiQ5OFh7cOI1bkDwLqdLw3Zg0cRJAAQ==" crossorigin=""/>
<script src="https://unpkg.com/leaflet@1.3.1/dist/leaflet.js" integrity="sha512-/Nsx9X4HebavoBvEBuyp3I7od5tA0UzAxs+j83KgC8PU0kgB4XiK4Lfe4y4cgBtaRJQEIFCW+oC506aPT2L1zw==" crossorigin=""></script>
<style>
html, body {
height: 100%;
margin: 0;
}
#map {
width: 600px;
height: 400px;
}
</style>
<style>body { padding: 0; margin: 0; } #map { height: 100%; width: 100vw; }</style>
</head>
<body>
<div id='map'></div>
<script>
var map = L.map('map').fitWorld();
L.tileLayer('https://api.tiles.mapbox.com/v4/{id}/{z}/{x}/{y}.png?access_token=pk.eyJ1IjoibWFwYm94IiwiYSI6ImNpejY4NXVycTA2emYycXBndHRqcmZ3N3gifQ.rJcFIG214AriISLbB6B5aw', {
maxZoom: 18,
attribution: 'Map data © <a href="https://www.openstreetmap.org/">OpenStreetMap</a> contributors, ' +
'<a href="https://creativecommons.org/licenses/by-sa/2.0/">CC-BY-SA</a>, ' +
'Imagery © <a href="https://www.mapbox.com/">Mapbox</a>',
id: 'mapbox.streets'
}).addTo(map);
function onLocationFound(e) {
var radius = e.accuracy / 2;
L.marker(e.latlng).addTo(map)
.bindPopup("You are within " + radius + " meters from this point").openPopup();
L.circle(e.latlng, radius).addTo(map);
}
function onLocationError(e) {
alert(e.message);
}
map.on('locationfound', onLocationFound);
map.on('locationerror', onLocationError);
map.locate({setView: true, maxZoom: 16});
</script>
</body>
</html>
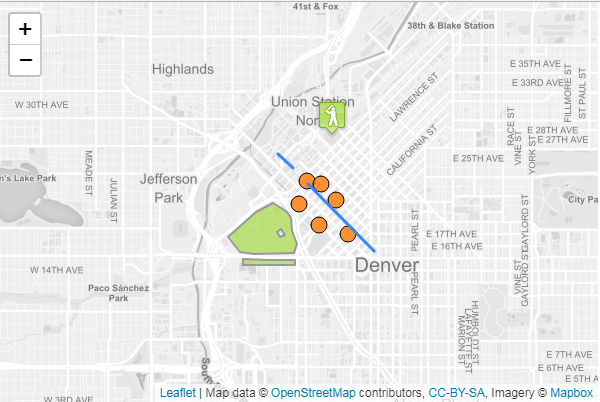
使用GeoJSON和Leaflet
GeoJSON正在成为许多GIS技术和服务中非常流行的数据格式 – 它非常简单,轻量级,简单明了,Leaflet在处理它方面非常出色。在本例中,您将学习如何创建从GeoJSON对象创建的地图矢量并与其交互。
关于GeoJSON
GeoJSON是用于编码各种地理数据结构的格式。GeoJSON对象可以表示几何,特征或特征的集合。GeoJSON支持以下几何类型:Point,LineString,Polygon,MultiPoint,MultiLineString,MultiPolygon和GeometryCollection。GeoJSON中的功能包含几何对象和附加属性,功能集合表示功能列表。
Leaflet支持上述所有GeoJSON类型,但Feature和FeatureCollections的效果最好,因为它们允许您使用一组属性来描述要素。我们甚至可以使用这些属性来设计我们的Leaflet矢量。以下是一个简单的GeoJSON功能的例子
var geojsonFeature = {
    "type": "Feature",
    "properties": {
        "name": "Coors Field",
        "amenity": "Baseball Stadium",
        "popupContent": "This is where the Rockies play!"
    },
    "geometry": {
        "type": "Point",
        "coordinates": [-104.99404, 39.75621]
    }
};
GeoJSON图层
GeoJSON对象通过GeoJSON图层添加到地图中。要创建它并将其添加到地图,我们可以使用以下代码:
L.geoJSON(geojsonFeature).addTo(map);
GeoJSON对象也可以作为有效的GeoJSON对象数组传递。
var myLines = [{
    "type": "LineString",
    "coordinates": [[-100, 40], [-105, 45], [-110, 55]]
}, {
    "type": "LineString",
    "coordinates": [[-105, 40], [-110, 45], [-115, 55]]
}];
或者,我们可以创建一个空的GeoJSON图层并将其分配给一个变量,以便我们可以在稍后添加更多功能。
var myLayer = L.geoJSON().addTo(map);
myLayer.addData(geojsonFeature);
选项
样式
该style选项可用于以两种不同方式设置功能。首先,我们可以传递一个简单的对象,以相同的方式对所有路径(折线和多边形)进行样式设置:
var myLines = [{
    "type": "LineString",
    "coordinates": [[-100, 40], [-105, 45], [-110, 55]]
}, {
    "type": "LineString",
    "coordinates": [[-105, 40], [-110, 45], [-115, 55]]
}];

var myStyle = {
    "color": "#ff7800",
    "weight": 5,
    "opacity": 0.65
};

L.geoJSON(myLines, {
    style: myStyle
}).addTo(map);
或者,我们可以传递一个函数,根据它们的属性设置各个特征的样式。在下面的例子中,我们检查“party”属性并相应地设置我们的多边形样式:
var states = [{
    "type": "Feature",
    "properties": {"party": "Republican"},
    "geometry": {
        "type": "Polygon",
        "coordinates": [[
            [-104.05, 48.99],
            [-97.22,  48.98],
            [-96.58,  45.94],
            [-104.03, 45.94],
            [-104.05, 48.99]
        ]]
    }
}, {
    "type": "Feature",
    "properties": {"party": "Democrat"},
    "geometry": {
        "type": "Polygon",
        "coordinates": [[
            [-109.05, 41.00],
            [-102.06, 40.99],
            [-102.03, 36.99],
            [-109.04, 36.99],
            [-109.05, 41.00]
        ]]
    }
}];

L.geoJSON(states, {
    style: function(feature) {
        switch (feature.properties.party) {
            case 'Republican': return {color: "#ff0000"};
            case 'Democrat':   return {color: "#0000ff"};
        }
    }
}).addTo(map);
pointToLayer
点的处理方式与折线和多边形不同。默认情况下,为GeoJSON点绘制简单的标记。在创建GeoJSON图层时,我们可以通过pointToLayer在GeoJSON选项对象中传递函数来改变这一点。该函数传递一个LatLng并返回一个ILayer的实例,在这种情况下可能是Marker或CircleMarker。
这里我们使用pointToLayer选项来创建一个CircleMarker:
var geojsonMarkerOptions = {
    radius: 8,
    fillColor: "#ff7800",
    color: "#000",
    weight: 1,
    opacity: 1,
    fillOpacity: 0.8
};

L.geoJSON(someGeojsonFeature, {
    pointToLayer: function (feature, latlng) {
        return L.circleMarker(latlng, geojsonMarkerOptions);
    }
}).addTo(map);
我们也可以style在这个例子中设置属性 – 如果您在pointToLayer函数内部创建了一个像圆圈一样的矢量图层,Leaflet足够聪明,可以将样式应用于GeoJSON点。
onEachFeature
该onEachFeature选项是在将每个功能添加到GeoJSON图层之前调用的功能。使用此选项的一个常见原因是在点击某个功能时附加弹出窗口。
function onEachFeature(feature, layer) {
    // does this feature have a property named popupContent?
    if (feature.properties && feature.properties.popupContent) {
        layer.bindPopup(feature.properties.popupContent);
    }
}

var geojsonFeature = {
    "type": "Feature",
    "properties": {
        "name": "Coors Field",
        "amenity": "Baseball Stadium",
        "popupContent": "This is where the Rockies play!"
    },
    "geometry": {
        "type": "Point",
        "coordinates": [-104.99404, 39.75621]
    }
};

L.geoJSON(geojsonFeature, {
    onEachFeature: onEachFeature
}).addTo(map);
过滤
该filter选项可用于控制GeoJSON功能的可见性。要做到这一点,我们传递一个函数作为filter选项。这个函数被GeoJSON图层中的每个要素调用,并且通过feature和layer。然后,您可以利用该功能属性中的值通过返回true或来控制可见性false。
在下面的例子中,“Busch Field”不会显示在地图上。
var someFeatures = [{
    "type": "Feature",
    "properties": {
        "name": "Coors Field",
        "show_on_map": true
    },
    "geometry": {
        "type": "Point",
        "coordinates": [-104.99404, 39.75621]
    }
}, {
    "type": "Feature",
    "properties": {
        "name": "Busch Field",
        "show_on_map": false
    },
    "geometry": {
        "type": "Point",
        "coordinates": [-104.98404, 39.74621]
    }
}];

L.geoJSON(someFeatures, {
    filter: function(feature, layer) {
        return feature.properties.show_on_map;
    }
}).addTo(map);
代码
<!DOCTYPE html>
<html>
<head>
<title>GeoJSON tutorial - Leaflet</title>
<meta charset="utf-8" />
<meta name="viewport" content="width=device-width, initial-scale=1.0">
<link rel="shortcut icon" type="image/x-icon" href="docs/images/favicon.ico" />
<link rel="stylesheet" href="https://unpkg.com/leaflet@1.3.1/dist/leaflet.css" integrity="sha512-Rksm5RenBEKSKFjgI3a41vrjkw4EVPlJ3+OiI65vTjIdo9brlAacEuKOiQ5OFh7cOI1bkDwLqdLw3Zg0cRJAAQ==" crossorigin=""/>
<script src="https://unpkg.com/leaflet@1.3.1/dist/leaflet.js" integrity="sha512-/Nsx9X4HebavoBvEBuyp3I7od5tA0UzAxs+j83KgC8PU0kgB4XiK4Lfe4y4cgBtaRJQEIFCW+oC506aPT2L1zw==" crossorigin=""></script>
<style>
html, body {
height: 100%;
margin: 0;
}
#map {
width: 600px;
height: 400px;
}
</style>
</head>
<body>
<div id='map'></div>
<script src="sample-geojson.js" type="text/javascript"></script>
<script>
var map = L.map('map').setView([39.74739, -105], 13);
L.tileLayer('https://api.tiles.mapbox.com/v4/{id}/{z}/{x}/{y}.png?access_token=pk.eyJ1IjoibWFwYm94IiwiYSI6ImNpejY4NXVycTA2emYycXBndHRqcmZ3N3gifQ.rJcFIG214AriISLbB6B5aw', {
maxZoom: 18,
attribution: 'Map data © <a href="https://www.openstreetmap.org/">OpenStreetMap</a> contributors, ' +
'<a href="https://creativecommons.org/licenses/by-sa/2.0/">CC-BY-SA</a>, ' +
'Imagery © <a href="https://www.mapbox.com/">Mapbox</a>',
id: 'mapbox.light'
}).addTo(map);
var baseballIcon = L.icon({
iconUrl: 'baseball-marker.png',
iconSize: [32, 37],
iconAnchor: [16, 37],
popupAnchor: [0, -28]
});
function onEachFeature(feature, layer) {
var popupContent = "<p>I started out as a GeoJSON " +
feature.geometry.type + ", but now I'm a Leaflet vector!</p>";
if (feature.properties && feature.properties.popupContent) {
popupContent += feature.properties.popupContent;
}
layer.bindPopup(popupContent);
}
L.geoJSON([bicycleRental, campus], {
style: function (feature) {
return feature.properties && feature.properties.style;
},
onEachFeature: onEachFeature,
pointToLayer: function (feature, latlng) {
return L.circleMarker(latlng, {
radius: 8,
fillColor: "#ff7800",
color: "#000",
weight: 1,
opacity: 1,
fillOpacity: 0.8
});
}
}).addTo(map);
L.geoJSON(freeBus, {
filter: function (feature, layer) {
if (feature.properties) {
// If the property "underConstruction" exists and is true, return false (don't render features under construction)
return feature.properties.underConstruction !== undefined ? !feature.properties.underConstruction : true;
}
return false;
},
onEachFeature: onEachFeature
}).addTo(map);
var coorsLayer = L.geoJSON(coorsField, {
pointToLayer: function (feature, latlng) {
return L.marker(latlng, {icon: baseballIcon});
},
onEachFeature: onEachFeature
}).addTo(map);
</script>
</body>
</html>
———————————————————————-
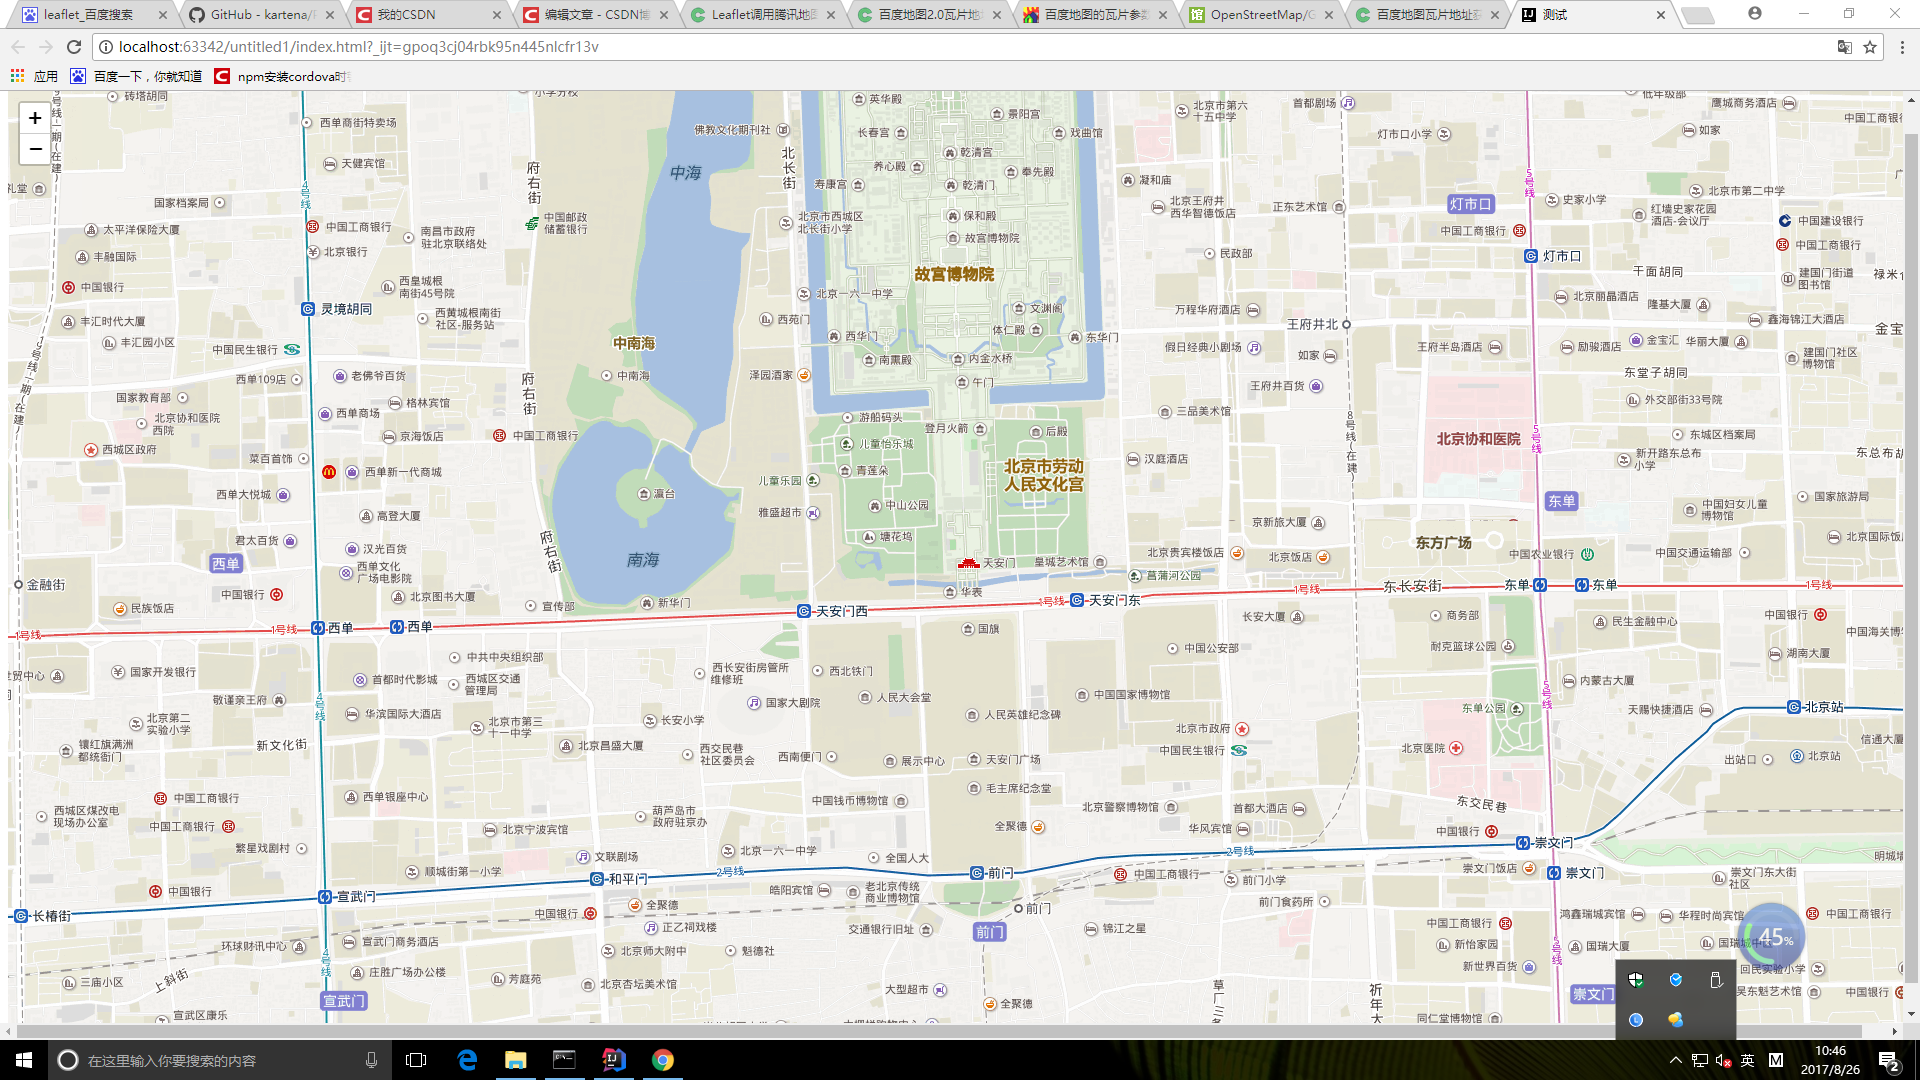
Leaflet加载百度题图
Leaflet是一款开源的轻量级地图插件,但是个人人为这个轻量级有点假,因为轻的代价就是很多东西都没有,需要插件或者自己扩展,在别人的基础上修改了加载百度地图的功能。
首先,需要使用leaflet的一款proj4插件。然后才能使用下面的代码。
<!DOCTYPE html>
<html lang="en">
<head>
    <meta charset="UTF-8">
    <title>测试</title>
    <link href="leaflet/leaflet.css" type="text/css" rel="stylesheet"/> >
    <script src="leaflet/leaflet.js"></script>
    <script src="leaflet/proj4.js"></script>
    <script src="leaflet/proj4leaflet.js"></script>
</head>
<body>
<div id="map" style="width: 100vw;height: 100vh">
</div>
<script>
    var crs = new L.Proj.CRS('EPSG:900913',
        '+proj=merc +a=6378206 +b=6356584.314245179 +lat_ts=0.0 +lon_0=0.0 +x_0=0 +y_0=0 +k=1.0 +units=m +nadgrids=@null +wktext  +no_defs',
        {
            resolutions: function () {
                level = 19;
                var res = [];
                res[0] = Math.pow(2, 18);
                for (var i = 1; i < level; i++) {
                    res[i] = Math.pow(2, (18 - i))
                }
                return res;
            }(),
            origin: [0,0],
            bounds: L.bounds([20037508.342789244, 0], [0, 20037508.342789244])
        }),
        map = L.map('map', {
            crs: crs
        });

    new L.TileLayer('http://online{s}.map.bdimg.com/tile/?qt=tile&x={x}&y={y}&z={z}&styles=pl&udt=20150518', {
        maxZoom: 18,
        minZoom: 3,
        subdomains: [0,1,2],
        tms: true
    }).addTo(map);
    map.setView([39.915052,116.403954], 15);
</script>
</body>
</html>
最后的结果如下图:
———————————————————————————————–
leaflet地图联动的简单实现
拖拽或放大一个地图的时候,其他地图进行相同操作.
/将要联动的地图加入数组
 var maps = [mymap,mymap2,mymap3];
 //地图联动实现
 function maplink(e){
   var _this = this;
   maps.map(function (t) {
     t.setView(_this.getCenter(),_this.getZoom())
   })
 }
 //绑定
 maps.map(function (t) {
   t.on({drag:maplink,zoom:maplink})
 })
查看效果的话完整如下 ,地图随便摆的不要介意
<!DOCTYPE html>
<html lang="en">
<head>
    <meta charset="UTF-8">
    <title>Title</title>
    <link rel="stylesheet" href="https://unpkg.com/leaflet@1.2.0/dist/leaflet.css"
          integrity="sha512-M2wvCLH6DSRazYeZRIm1JnYyh22purTM+FDB5CsyxtQJYeKq83arPe5wgbNmcFXGqiSH2XR8dT/fJISVA1r/zQ=="
          crossorigin=""/>
    <script src="https://unpkg.com/leaflet@1.2.0/dist/leaflet.js"
            integrity="sha512-lInM/apFSqyy1o6s89K4iQUKg6ppXEgsVxT35HbzUupEVRh2Eu9Wdl4tHj7dZO0s1uvplcYGmt3498TtHq+log=="
            crossorigin=""></script>
    <style>

        #mapid { height: 500px;width:400px;}
        #mapid2 {position:fixed; left:500px;top:0;height: 500px;width:400px;}
        #mapid3 { height: 500px;width:400px;}
    </style>
</head>
<body>
<div id="mapid"></div>
<div id="mapid2"></div>
<div id="mapid3"></div>
<script>


  var mymap = L.map('mapid').setView([51.505, -0.09], 13);
  var mymap2=L.map('mapid2').setView([51.505, -0.09], 13);
  var mymap3=L.map('mapid3').setView([51.505, -0.09], 13);
  var lay = L.tileLayer('https://api.tiles.mapbox.com/v4/{id}/{z}/{x}/{y}.png?access_token=pk.eyJ1IjoibWFwYm94IiwiYSI6ImNpejY4NXVycTA2emYycXBndHRqcmZ3N3gifQ.rJcFIG214AriISLbB6B5aw', {
    maxZoom: 18,
    id: 'mapbox.streets'
  })
  var lay2 = L.tileLayer('https://api.tiles.mapbox.com/v4/{id}/{z}/{x}/{y}.png?access_token=pk.eyJ1IjoibWFwYm94IiwiYSI6ImNpejY4NXVycTA2emYycXBndHRqcmZ3N3gifQ.rJcFIG214AriISLbB6B5aw', {
    maxZoom: 18,
    id: 'mapbox.streets'
  });
  var lay3 = L.tileLayer('https://api.tiles.mapbox.com/v4/{id}/{z}/{x}/{y}.png?access_token=pk.eyJ1IjoibWFwYm94IiwiYSI6ImNpejY4NXVycTA2emYycXBndHRqcmZ3N3gifQ.rJcFIG214AriISLbB6B5aw', {
    maxZoom: 18,
    id: 'mapbox.streets'
  });
  lay.addTo(mymap);
  lay2.addTo(mymap2);
  lay3.addTo(mymap3);

  //将要联动的地图加入数组
  var maps = [mymap,mymap2,mymap3];
  //地图联动实现
  function maplink(e){
    var _this = this;
    maps.map(function (t) {
      t.setView(_this.getCenter(),_this.getZoom())
    })
  }
  //绑定
  maps.map(function (t) {
    t.on({drag:maplink,zoom:maplink})
  })
</script>
</body>
</html>
——————————————————————
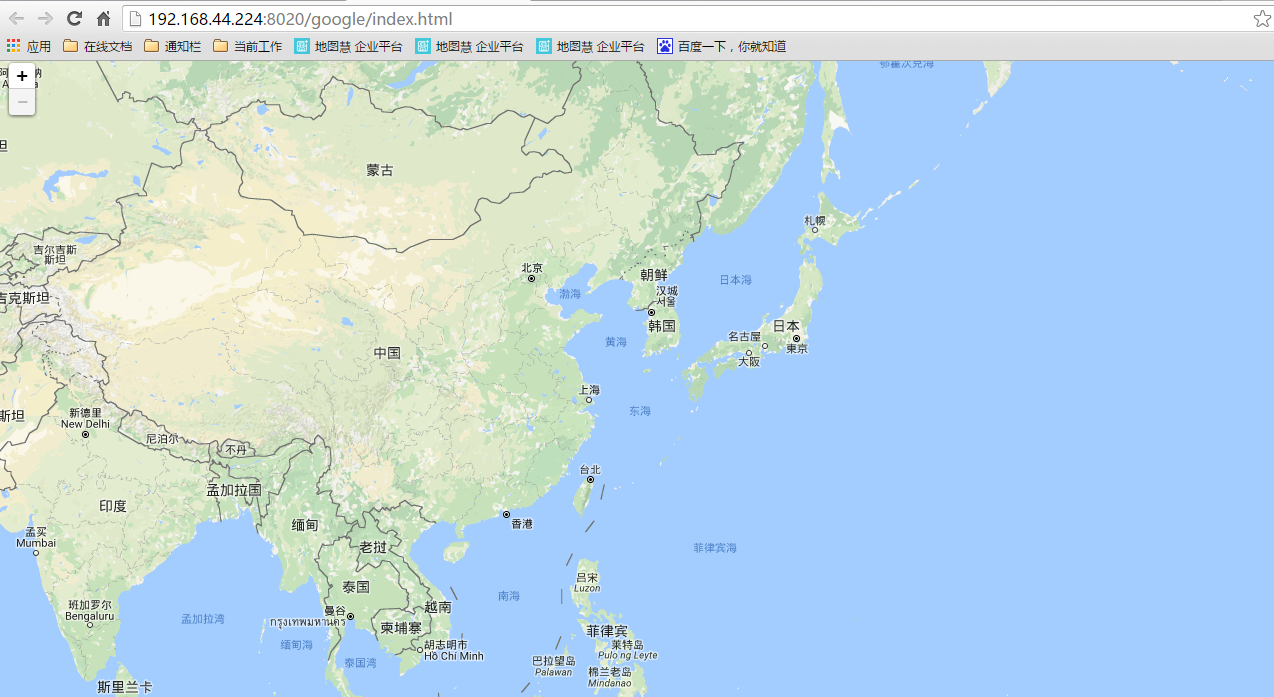
leaflet加载google.cn底图
需要在生成图层的时候拼上参数就行。
//重点就是tileLayer的第一个参数设置
var layer = L.tileLayer('http://mt0.google.cn/vt/lyrs=m@160000000&hl=zh-CN&gl=CN&src=app&y={y}&x={x}&z={z}&s=Ga', {
attribution: '© <a href="http://osm.org/copyright">OpenStreetMap</a> contributors'
});
var map = L.map('allmap',{
minZoom: 4,
maxZoom: 13
}).setView([48.505, 3.09], 13);
L.control.scale({'position':'bottomleft','metric':true,'imperial':false}).addTo(map);
map.addLayer(layer);
实测可用
转载自:https://blog.csdn.net/WYpersist/article/details/80523721