
a
leaflet前期学习到熟练使用就不说了,当前接到个任务,项目需求要增加航空气象监测,经研究决定使用windy api,windy支持各种图层显示,使用的是webGL渲染,可以根据高度进行渲染,满足要求且速度很快,但问题来了,我的项目使用的是leaflet1.2.0版本,而windy只支持0.7.5和0.7.7版本,看了下leaflet更新log发现,差距太大了啊,不过还好windy干的事情不多,仅仅是调几个add方法添加canvas,因此决定改windy源码与leaflet1.2.0兼容,相关如下:
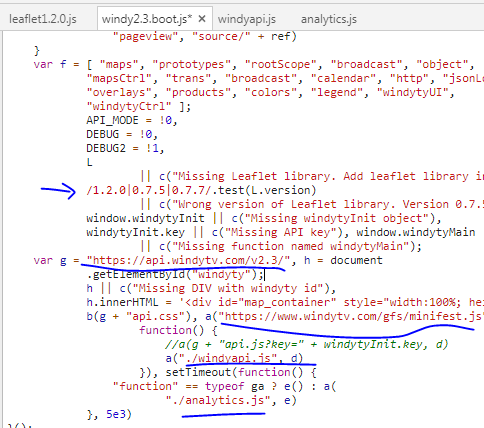
下载相关源码并修改兼容(windy做的挺~~)
然后debug就会发现其实他主要:
initCanvas: function () {
    var mya = L.canvasOverlay();
    var a = mya.addTo(e);
    var b = a.canvas();
     //var a = L.canvasOverlay().addTo(e), b = a.canvas();曾经的写法,我只是为了看看a能回来个啥
     this.canvases = {
         particleCanvas: b[0],
         overlayCanvas: [b[1], b[2]],
         actualCanvas: 0
     }, this.resetCanvas = a.reset.bind(a), b[2].style.opacity = 0, this.rescaleCanvas()
 },
 最终发现正常的b是有3个canvas的,于是知道了:
 windy的addTo方法调leaflet的addLayer,生成了3个canvas:
windyapi的addTo: function (a) {
return a.addWindyLayer(this), this//原来是addLayer
}
//leaflet1.2
addLayer: function (t) {
if (!t._layerAdd) throw new Error("The provided object is not a Layer.");
var i = n(t);
return this._layers[i] ? this : (this._layers[i] = t, t._mapToAdd = this, t.beforeAdd && t.beforeAdd(this), this.whenReady(t._layerAdd, t), this)
},
addWindyLayer: function (t) { //zz~~此处我模仿addLayer写了个函数
var e = windy_stamp(t);
return this._layers[e] ? this : (this._layers[e] = t, !t.options || isNaN(t.options.maxZoom) && isNaN(t.options.minZoom) || (this._zoomBoundLayers[e] = t, this._updateZoomLevels()), this.options.zoomAnimation && o.TileLayer && t instanceof o.TileLayer && (this._tileLayersNum++, this._tileLayersToLoad++, t.on("load", this._onTileLayerLoad, this)), this._loaded && windy_layerAdd(t,this), this)
},其中
function windy_stamp () {//zz
    var t = 0, e = "_leaflet_id";
    return function (i) {
        return i[e] = i[e] || ++t, i[e]
    }
}
function windy_layerAdd(t,zzthis) {//zz
    t.onAdd(zzthis), zzthis.fire("layeradd", {layer: t})
}
而onAdd:
onAdd: function (a) {
            this._map = a, this._canvas1 = L.DomUtil.create("canvas", "leaflet-canvas1"), this._canvas2 = L.DomUtil.create("canvas", "leaflet-canvas2"), this._canvas3 = L.DomUtil.create("canvas", "leaflet-canvas3");
            var b = this._map.getSize();
            this._canvas1.width = this._canvas2.width = this._canvas3.width = b.x, this._canvas1.height = this._canvas2.height = this._canvas3.height = b.y;
            var c = this._map.options.zoomAnimation && L.Browser.any3d;
            L.DomUtil.addClass(this._canvas1, "leaflet-zoom-" + (c ? "animated" : "hide")), L.DomUtil.addClass(this._canvas2, "leaflet-zoom-" + (c ? "animated" : "hide")), L.DomUtil.addClass(this._canvas3, "leaflet-zoom-" + (c ? "animated" : "hide")), a._panes.overlayPane.appendChild(this._canvas1), a._panes.overlayPane.appendChild(this._canvas2), a._panes.overlayPane.appendChild(this._canvas3), a.on("moveend", this._redraw, this), a.on("resize", this._resize, this), a.options.zoomAnimation && L.Browser.any3d && a.on("zoomanim", this._animateZoom, this), this._reset(), this._redraw()
        }
回来后: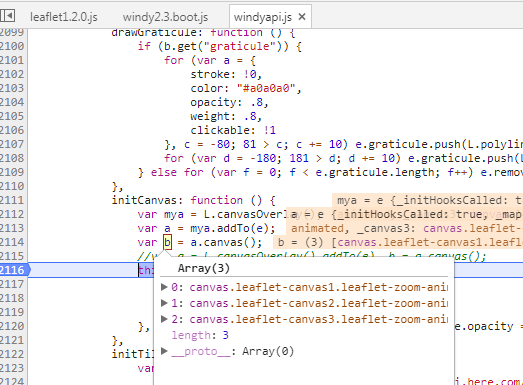
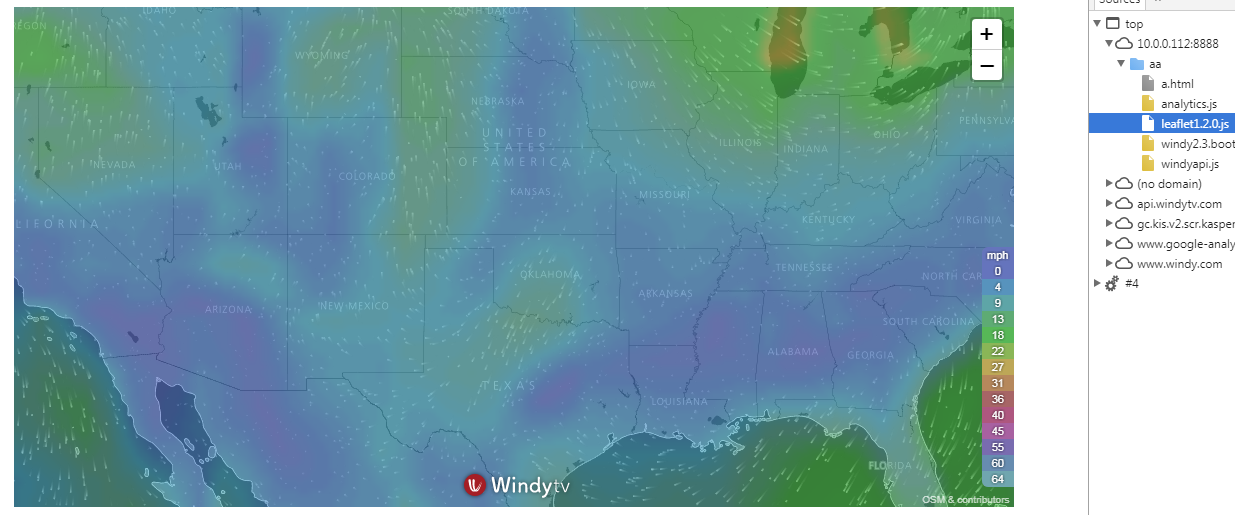
效果图:支持leaflet1.2.0
转载自:https://blog.csdn.net/qq_29040363/article/details/78549661

