Leaflet 官方教程 Working with map panes 处理map panes
目录
在leaflet中,map pane是一个很有用的属性,它决定了图层在地图上的排列顺序。一般情况下,先加载的图层在下,后加载的图层在上,而map pane使得我们可以忽略加载顺序的影响,提前确定好我们要加载的多个图层在地图中的排列顺序。图层的z-index有类似的功能,可以对map pane相同的图层的排列顺序进一步的控制。
下面我们看一下官网是怎么介绍map pane属性的。
How the default map panes work to display overlays on top of tiles, and how to override that.
本教程将为你解答:默认的map panes是如何使overlays图层展示在切片图层之上的,以及如何改变它。
What are panes?
panes是什么?
In Leaflet, map panes group layers together implicitly, without the developer knowing about it. This grouping allows web browsers to work with several layers at once in a more efficient way than working with layers individually.
在Leaflet中,map panes会将图层分组,对开发人员是透明的,这使得浏览器能够更有效的一次处理多个图层,而不是一次处理一个图层。
Map panes use the z-index CSS property to always show some layers on top of others. The default order is:
Map panes 使用z-index CSS属性来控制某些图层显示在其他图层之上。默认的顺序如下:
TileLayers andGridLayersPaths, like lines, polylines, circles, orGeoJSONlayers.MarkershadowsMarkericonsPopups
This is why, in Leaflet maps, popups always show “on top” of other layers, markers always show on top of tile layers, etc.
这也是为什么在Leaflet地图中,popups会显示在其他图层之上,markers总是显示在切片图层之上等等的原因。
A new feature of Leaflet 1.0.0 (not present in 0.7.x) is custom map panes, which allows for customization of this order.
Leaflet 1.0.0之后增加了一个新特性(0.7.X没有)可以自定义map panes,用于调整默认的顺序。
The default is not always right
默认情况并不总是合适的
In some particular cases, the default order is not the right one for the map. We can demonstrate this with the Carto basemaps and labels:
在某些特殊情况下,默认的图层排序并不总是合适的。我们用下面的底图和标注图层的例子解释一下:
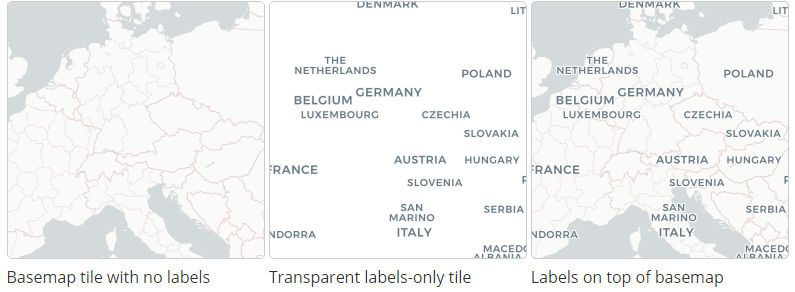
没有标注的底图、透明的标注图层、标注图层在底图之上
If we create a Leaflet map with these two tile layers, any marker or polygon will show on top of both, but having the labels on top looks much nicer. How can we do that?
如果我们为Leaflet 底图添加了上述两图层,marker和polygon会显示在两图层的上方,不过让标注显示在最上面可能是更好地选择。这样的话我们该怎样实现呢?
| See this example stand-alone. |
Custom pane
自定义pane
We can use the defaults for the basemap tiles and some overlays like GeoJSON layers, but we have to define a custom pane for the labels, so they show on top of the GeoJSON data.
对于底图和overlays图层如GeoJSON图层我们可以使用其默认设置,不过对于标注图层我们就需要自定义一个pane了,以使其显示在GeoJSON图层之上。
Custom map panes are created on a per-map basis, so first create an instance of L.Map and the pane:
自定义map panes都依赖于固定的地图,所以我们首先应创建一个地图实例L.Map以及所需pane:
var map = L.map('map');
map.createPane('labels');
The next step is setting the z-index of the pane. Looking at the defaults, a value of 650 will make the TileLayer with the labels show on top of markers but below pop-ups. By using getPane(), we have a reference to the HTMLElementrepresenting the pane, and change its z-index:
下一步就是设置pane的z-index。可以查看各pane的默认值,将新pane的z-index设置为650可以使标注图层显示在markers图层之上popups图层之下。使用getPane方法可以获取pane的Html元素,然后设置其z-index值。
map.getPane('labels').style.zIndex = 650;
One of the problems of having image tiles on top of other map layers is that the tiles will capture clicks and touches. If a user clicks anywhere on the map, the web browser will assume she clicked on the labels tiles, and not on the GeoJSON or on the markers. This can be solved using the pointer-events CSS property:
让切片图层位于其他图层之上的问题之一就是切片会捕获点击或触摸等事件。如果用户点击了地图的某个区域,浏览器会认为用户点击的是切片图层,而非GeoJSON 元素或者markers。使用 CSS属性pointer-events 可以解决该问题。
map.getPane('labels').style.pointerEvents = 'none';
With the pane now ready, we can add the layers, paying attention to use the pane option on the labels tiles:
新增的pane已经设置好了,我们可以添加图层了,注意要在标注切片图层上使用pane options参数。
var positron = L.tileLayer('http://{s}.basemaps.cartocdn.com/light_nolabels/{z}/{x}/{y}.png', {
        attribution: '©OpenStreetMap, ©CartoDB'
}).addTo(map);

var positronLabels = L.tileLayer('http://{s}.basemaps.cartocdn.com/light_only_labels/{z}/{x}/{y}.png', {
        attribution: '©OpenStreetMap, ©CartoDB',
        pane: 'labels'
}).addTo(map);

var geojson = L.geoJson(GeoJsonData, geoJsonOptions).addTo(map);
Finally, add some interaction to each feature on the GeoJSON layer:
最后,为GeoJSON图层中的矢量元素添加一些交互操作。
geojson.eachLayer(function (layer) {
    layer.bindPopup(layer.feature.properties.name);
});

map.fitBounds(geojson.getBounds());
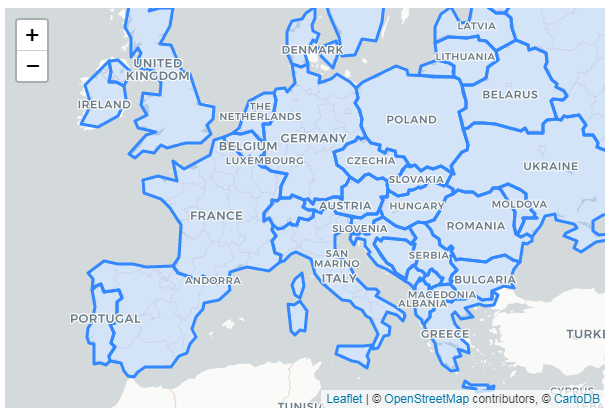
Now the example map is complete!
这样示例地图就完成了!
转载自:https://blog.csdn.net/pyluyuan/article/details/81612587