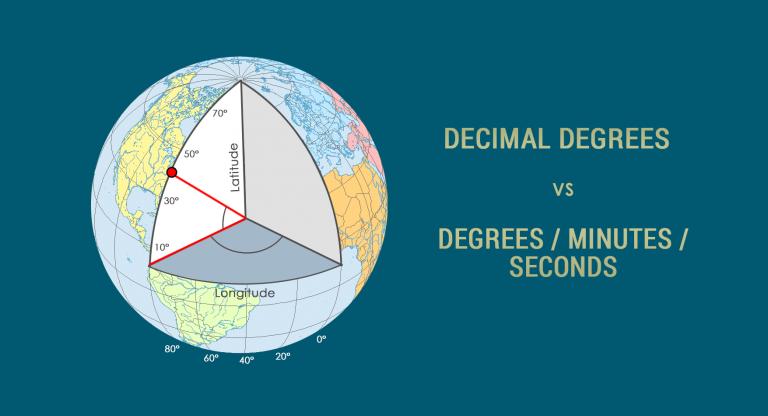
度/分/秒 (DMS) 与十进制 (DD)
我们可以使用纬度和经度坐标找到地球上的任何位置。我们用十进制或度/分/秒来测量这些坐标

gis,openlayers,leaflet,gis应用,geoai,geoserver,cesium,python,arcpy,arcmap,webgis,gis可视化
我们可以使用纬度和经度坐标找到地球上的任何位置。我们用十进制或度/分/秒来测量这些坐标
垂直基准面是指高度的零高程参考面。基准面用于测量平均海平面的高度和深度。
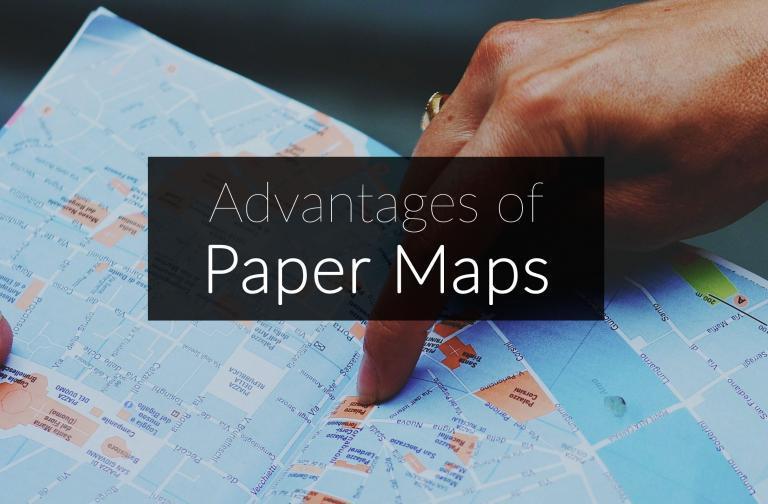
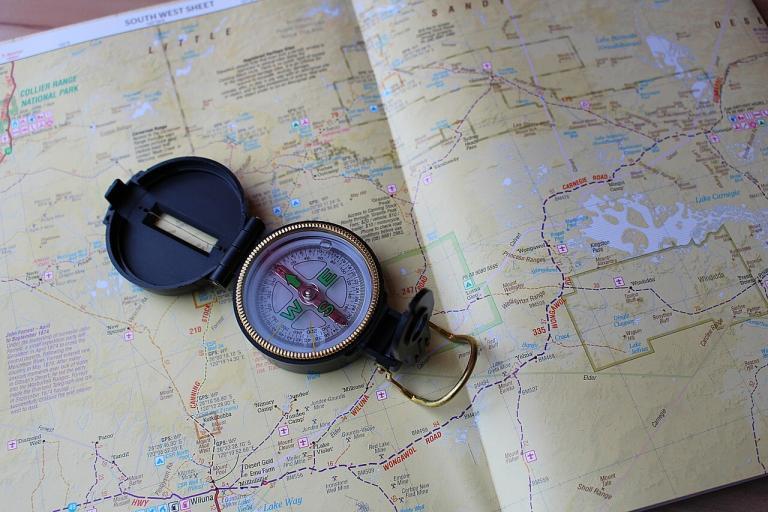
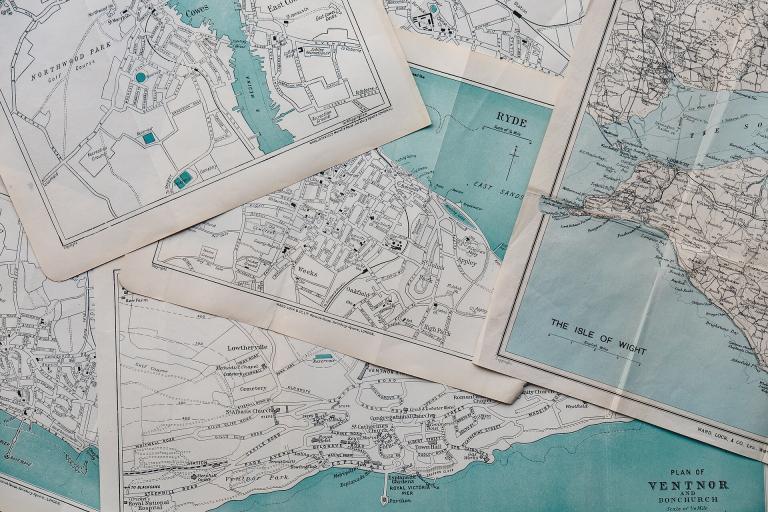
在数字制图时代,人们很容易忽视传统的纸质地图。但它们在我们这个时代仍然发挥着它们的作用。
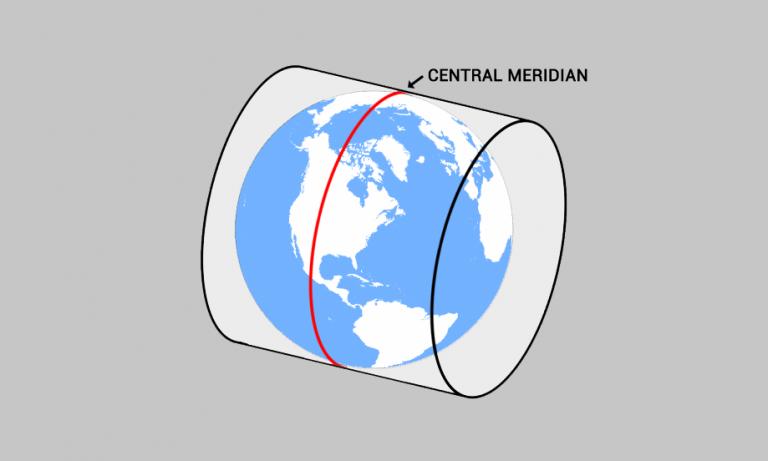
中央子午线是投影系统的经度中心线。投影坐标系通常将其用作 x 原点的参考点。
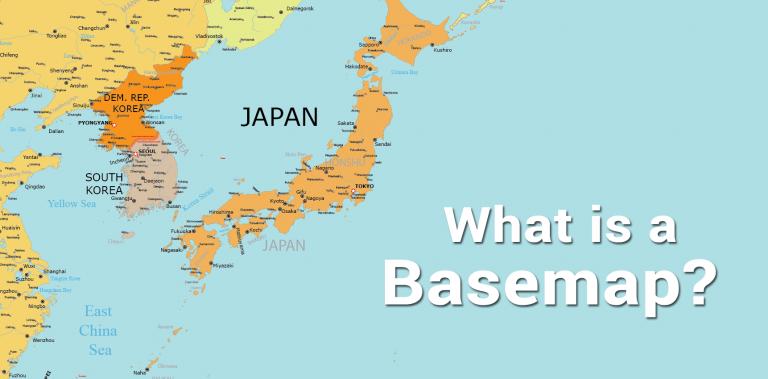
底图是制图学的基本组成部分,可为地图及其上方的其他数据集层提供地理环境。
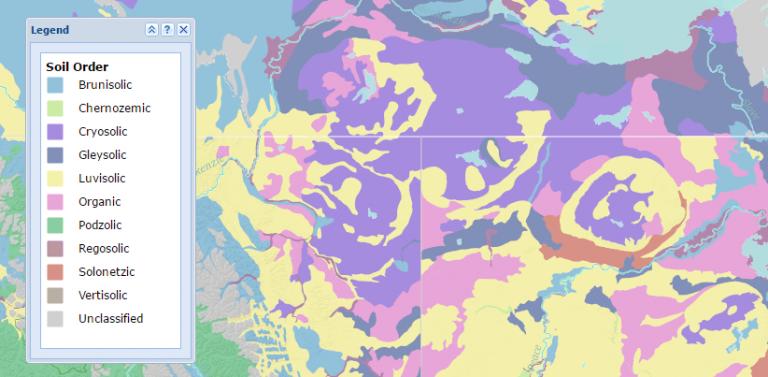
地图图例用于定义地图中的要素。图例键中的点、线和多边形符号是理解地图内容的驱动力。
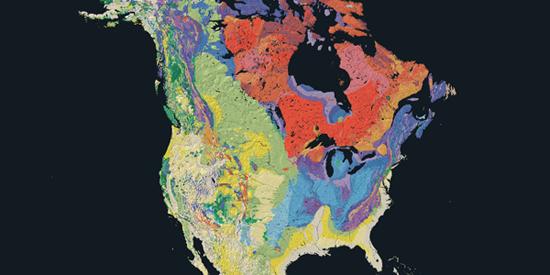
地质图描绘了底层岩层的位置。它展示了不同年代的岩石,展示了时代、时期和纪元。
有没有想过你的食物来自哪里?欣赏这些令人惊叹的农业地图,了解农业的未来。
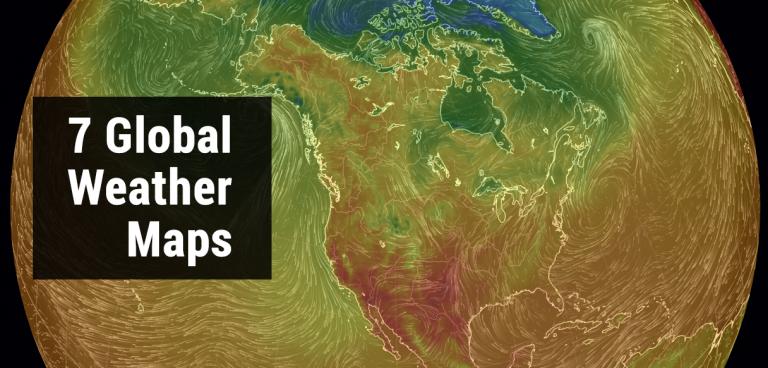
由于天气是基于位置的,因此 GIS 可以提供与众不同的天气信息。风雨无阻,这些互动式天气图会让你的一天充满阳光
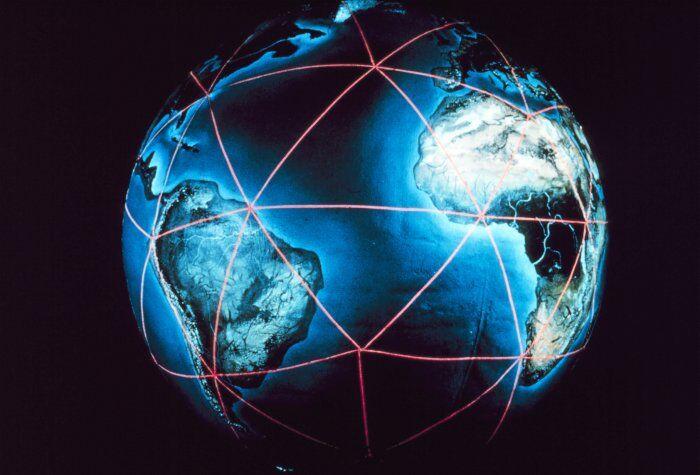
水平基准为地球上的纬度和经度坐标提供了参考框架。基准面是通过测量和三角测量构建的。

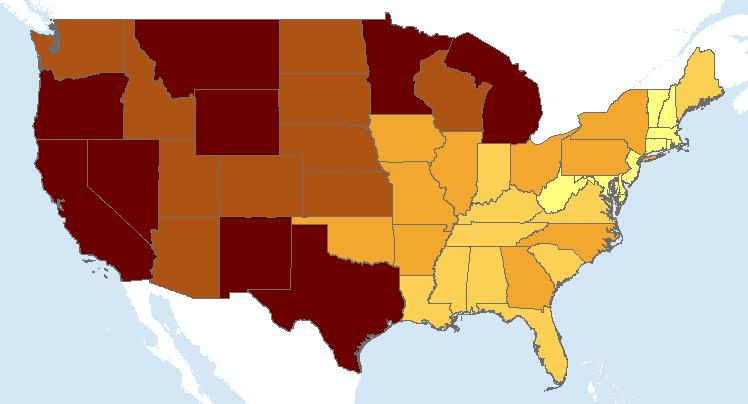
等区间分类方法将属性值划分为取数据的最小值和最大值的相等大小的范围。
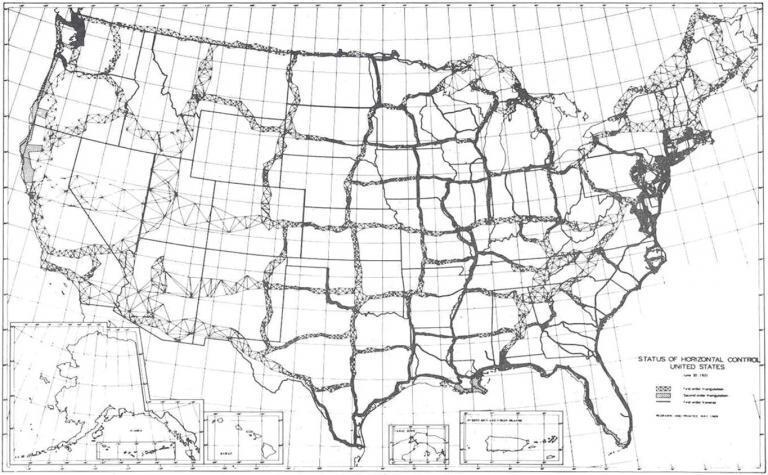
米德牧场是 NAD27 的焦点,所有位置都与它相关。一阶三角测量用于大约 26,000 个测量点
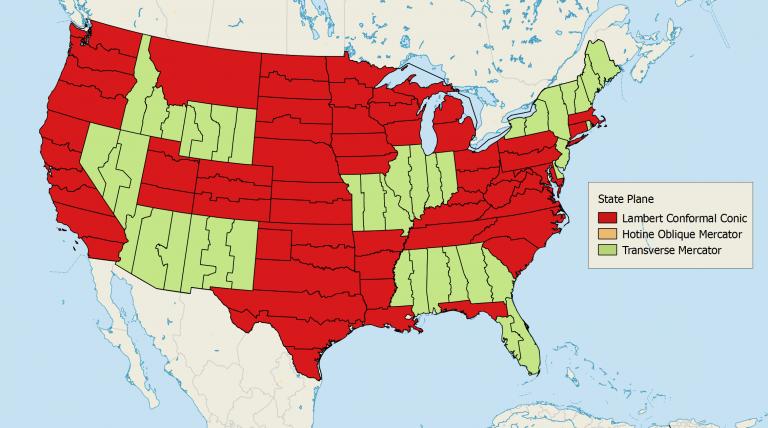
美国国家平面坐标系将美国划分为 124 个区域,以高精度(万分之一)定位任何点。
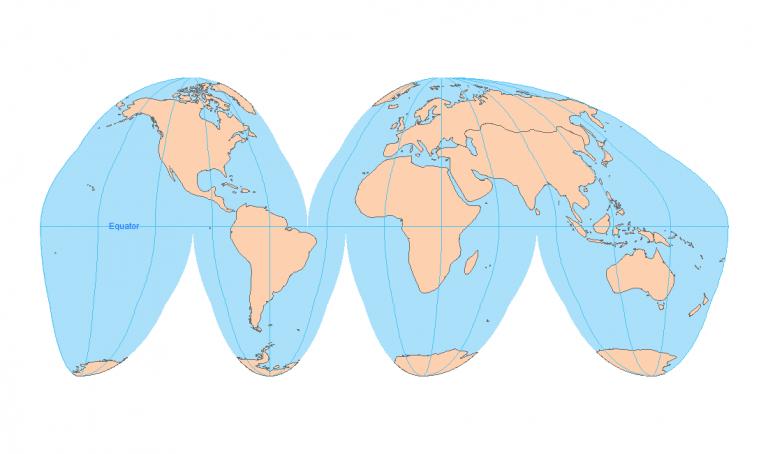
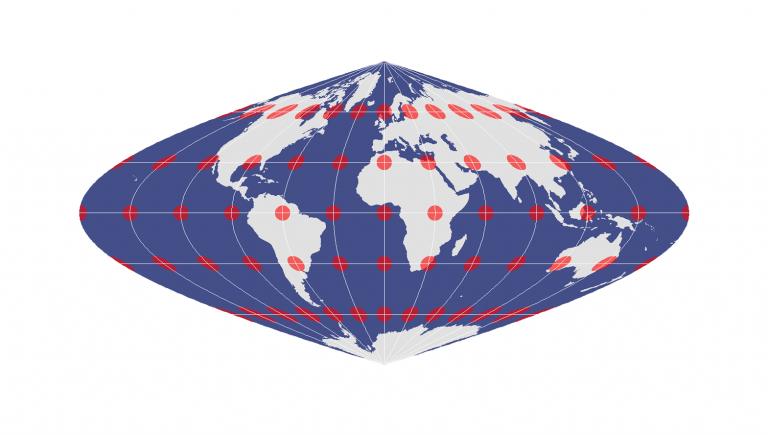
查看 Tissot 的指示线可以最好地理解地图失真。它包含圆圈并显示地图投影如何扭曲形状、大小和距离。

NAD27 和 NAD83 的位置水平精度可能相差几十米。基准转换将您的数据从一个基准校正到另一个基准。

从农作物生产到冰川融化,这些气候变化地图可帮助您清楚地了解我们不断变化的气候。
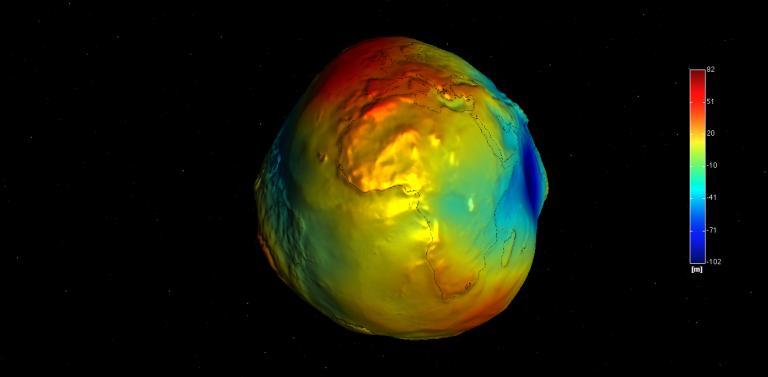
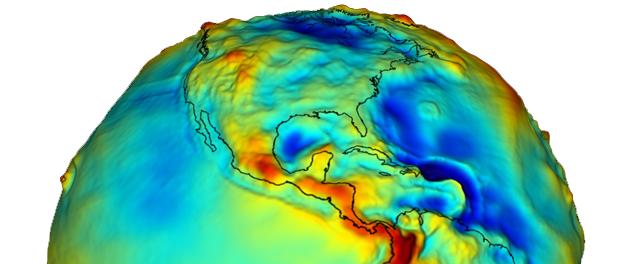
大地水准面测量意味着海平面和重力。 GRACE 和 GOCE 卫星提供了迄今为止最准确的大地水准面测量值。
本指南就像您的指南针——这 33 个制图技巧将引导您朝着正确的方向前进,并向您展示如何创建令人惊叹的制图地图。

North American Datum of 1983 (NAD83) 距地心 2 米,使用数千个带有三角测量的纪念碑来创建地球的参考框架
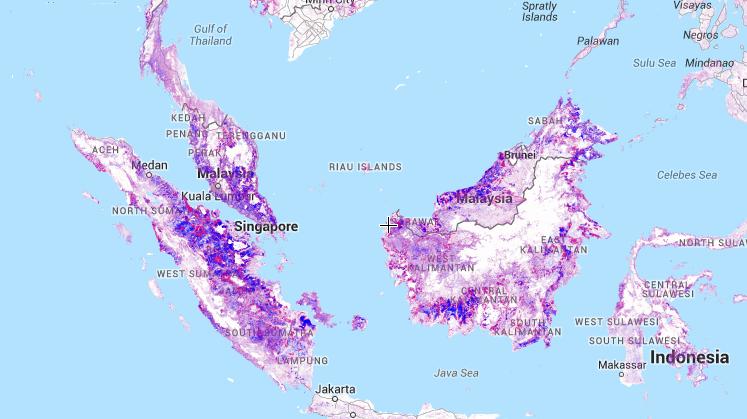
卫星和地图技术讲述了我们的树木和森林的故事。这 4 张全球森林地图将帮助您开始只见树木不见森林。
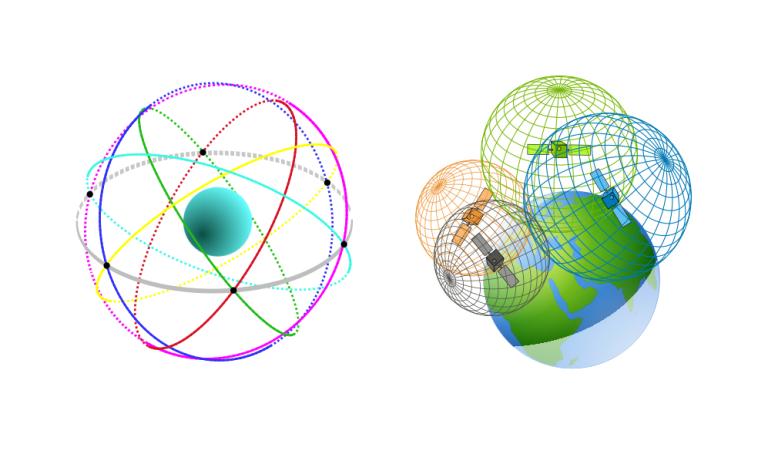
World Geodetic System 1984 (WGS84) 是 GPS 卫星的空间参考系统,与地球中心的误差小于 2 厘米。
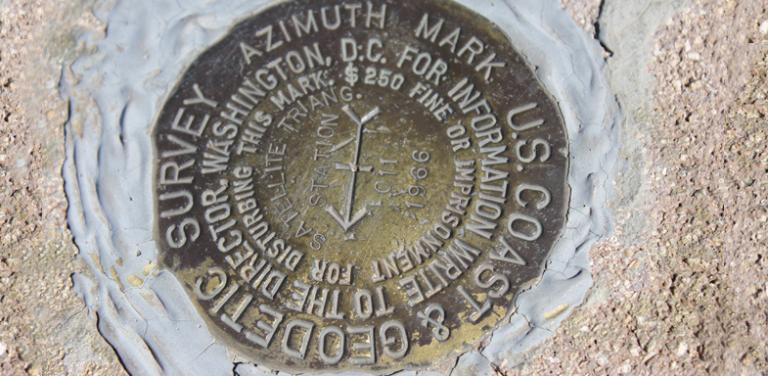
如果您认真对待寻宝,那么您可能听说过基准搜索。测量基准是地面上带有纬度和经度的圆盘。
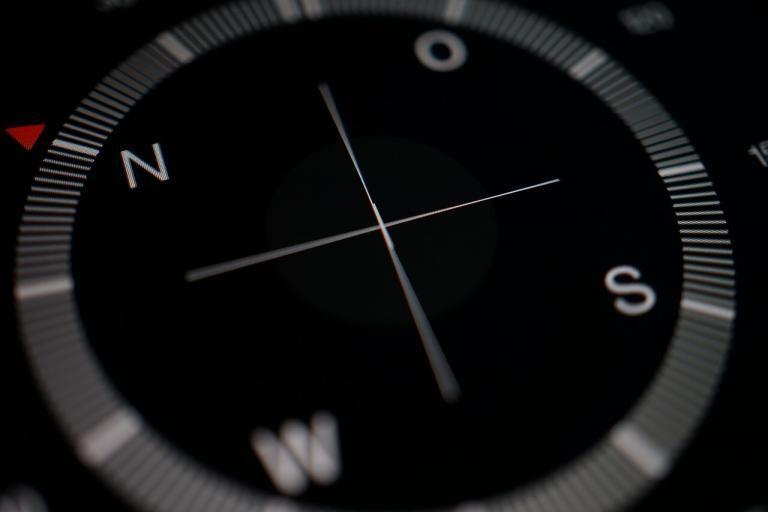
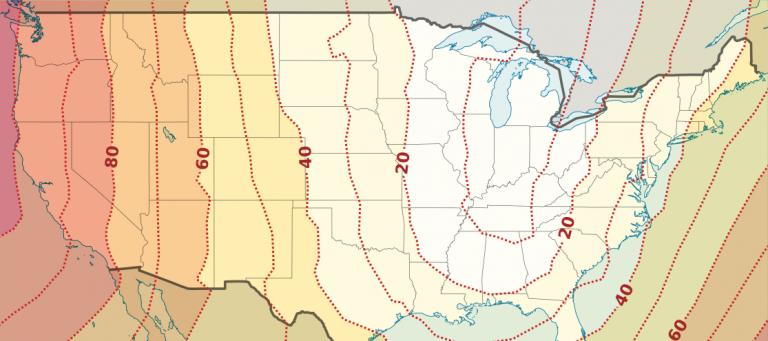
磁北极是加拿大北部的一个点,北方的吸引力线进入地球。罗盘指针指向磁北。
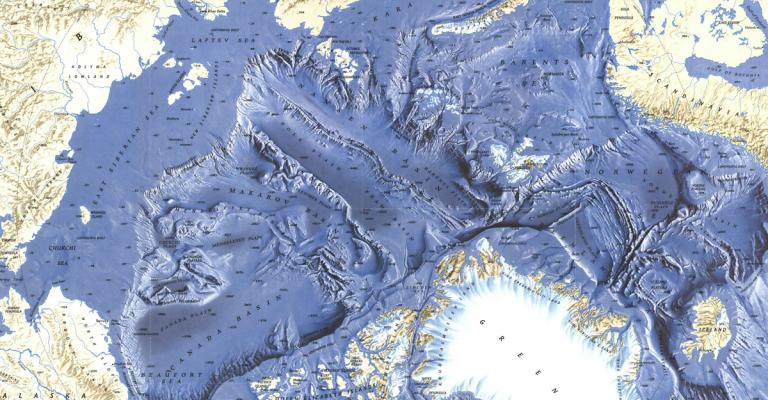
矿物开采、天然气以及潜在的航运路线。这些北极地图展示了人类发展最后的广阔疆域之一。
分位数分类对类进行划分,使每个类中的特征总数大致相同(这对显示排名很有用)

这是地球上最全面的全球交通地图列表之一。无论是飞机、火车还是汽车,您都会喜欢本指南。
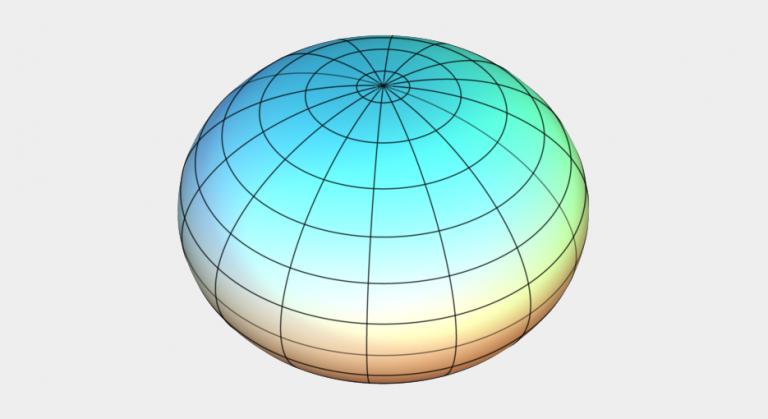
参考椭球体(例如 Clarke Ellipsoid)是地球形状的光滑数学模型。它有一个半长轴和短轴在两极处变平。
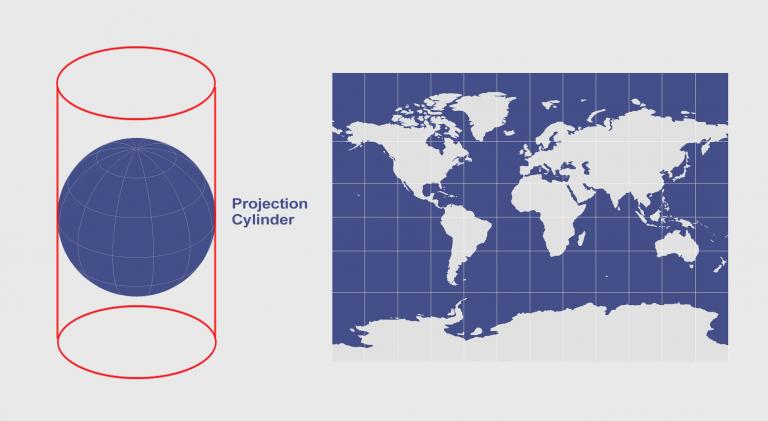
当您围绕地球放置一个圆柱体并将其展开时,您会得到类似于墨卡托投影、横向墨卡托投影和米勒投影的圆柱投影。
椭球体、测量基准和三角测量——这些是大地基准的组成部分。 NAD27、NAD83 和 WGS84 是北美常见的基准面。
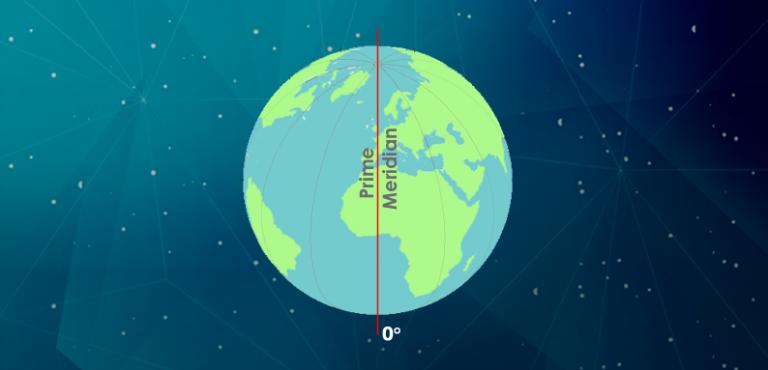
格林威治子午线(或本初子午线)是一个零度经线,它是我们测量东西 180 度的起点。
5 万圣节地图。几乎所有文化都承认灵魂,也就是死者。因此,我们为死者带来了这 5 张地图,让您感受到万圣节的气氛。
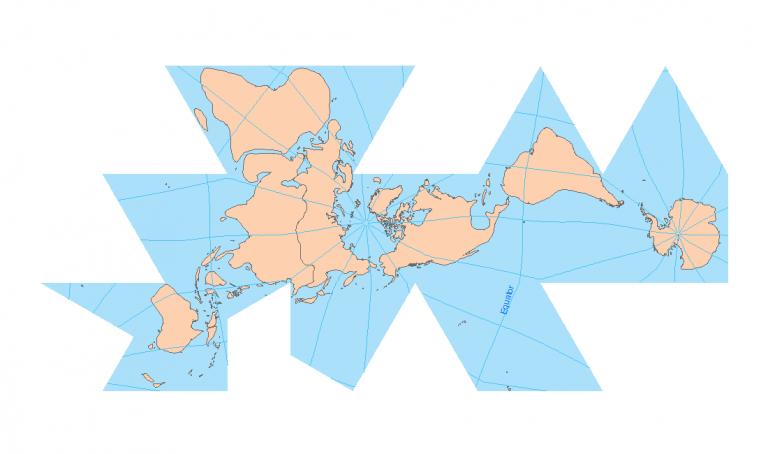
代表地球的最佳方式是使用地球仪。但是地图投影也非常有用。了解制图师为何在 GIS 中使用地图投影。
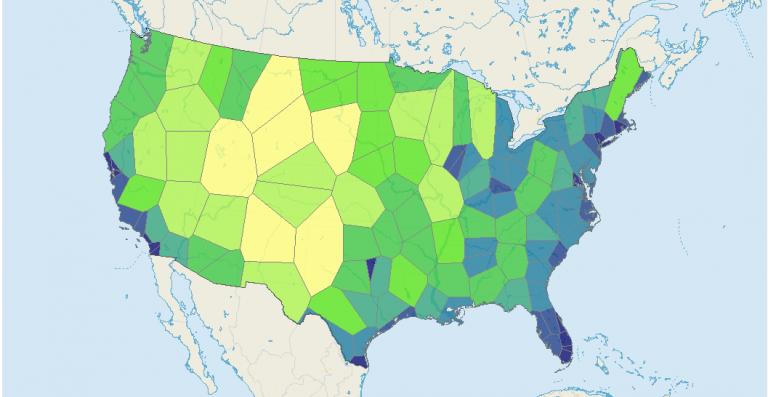
在 Voronoi 图中,当您在任何给定的泰森多边形中取一个点时,它表明它比任何其他点更接近该生成点。
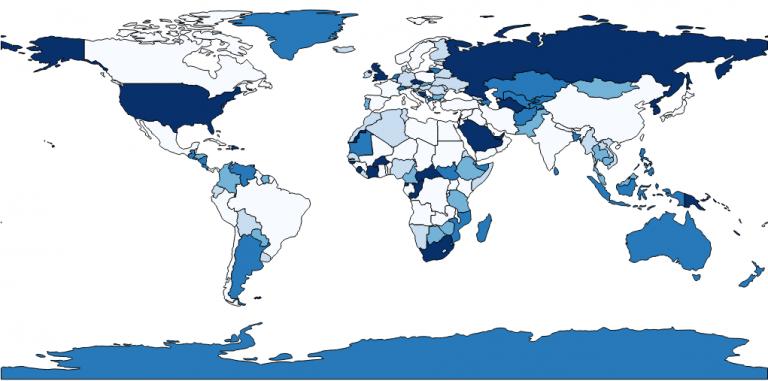
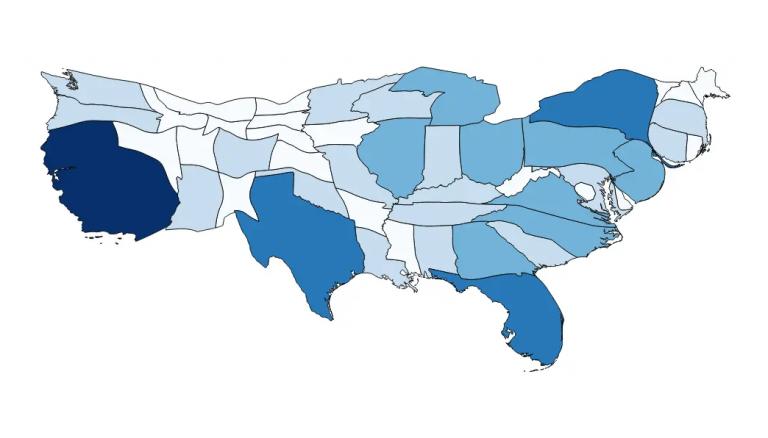
等间隔、分位数、自然间断、漂亮间断——数据分类方法生成不同的等值线图。我们在这里解释地图的类型。
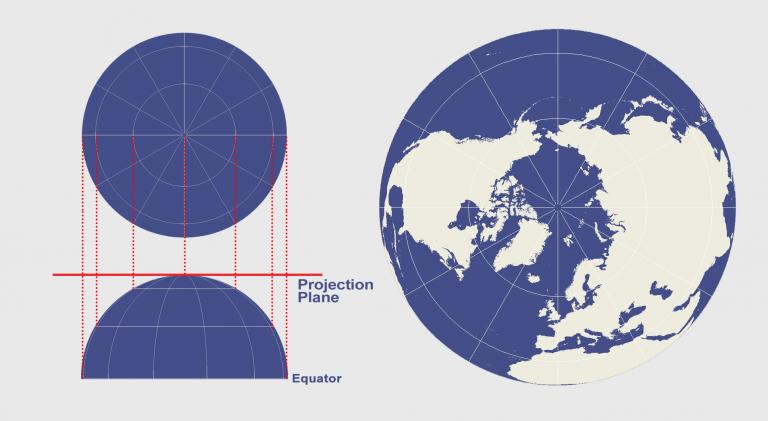
方位投影使用平面绘制地球表现面。例如,经常看到的方位投影是日经、立体和正交
等面积投影保留整个地图区域的相对大小。因此,这意味着在任何给定区域,它都会保持特征的真实大小和面积。
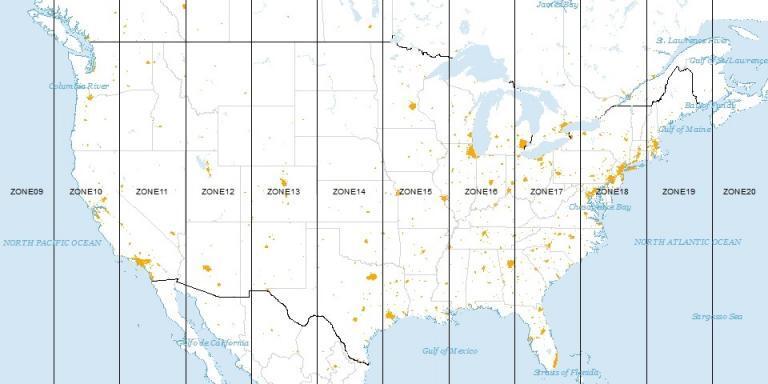
Universal Transverse Mercator (UTM) 将地球划分为 60 个区域(每个 UTM 区域为 6°°),并用自己的直立圆柱投影每个区域。
恒向线(或等角线)具有恒定方位并以相同角度穿过所有子午线。它们不是球体上两点之间的最短距离
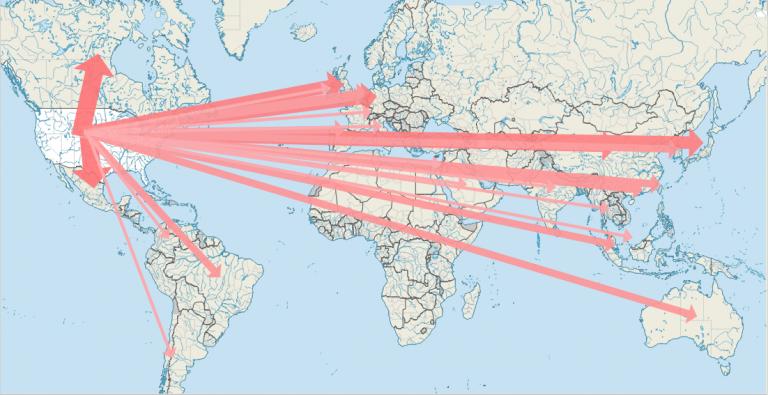
制图师使用线条在流量图中显示现象(人、思想或金钱)的运动。为了显示大小,他们改变了流线的宽度
制图地图扭曲现实以传达信息。它通过使用多边形几何体调整和放大任何变量来实现这一点。
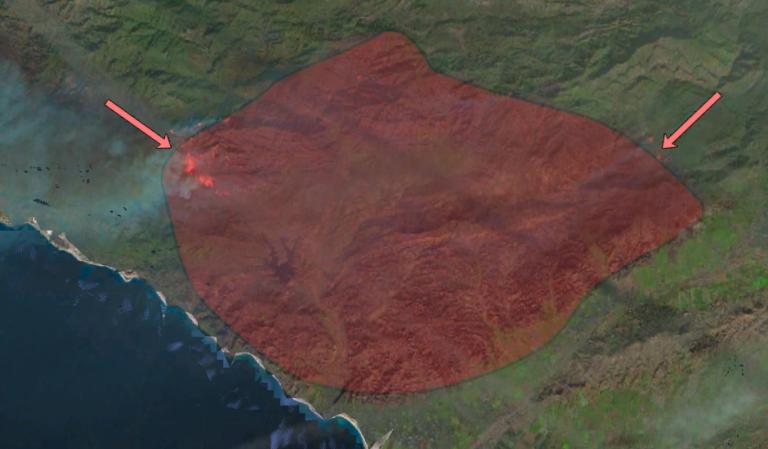
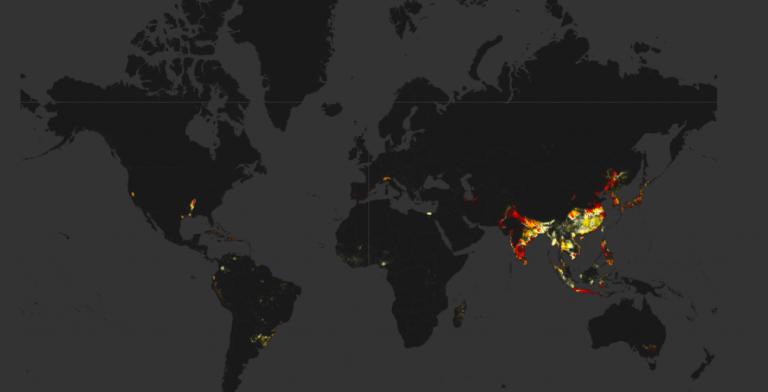
当野火燃烧时,卫星(MODIS 和 VIIRS)会跟踪森林火灾并向应急人员发出警告。这一切都进入了实时主动火力地图。

最佳在线地图的最终列表。这些展示了最先进的网络制图技术,例如实时提要、3D 视图和尖端可视化。

大地测量学是研究地球过去、现在和未来的形状、方向、位置和重力的应用数学领域。
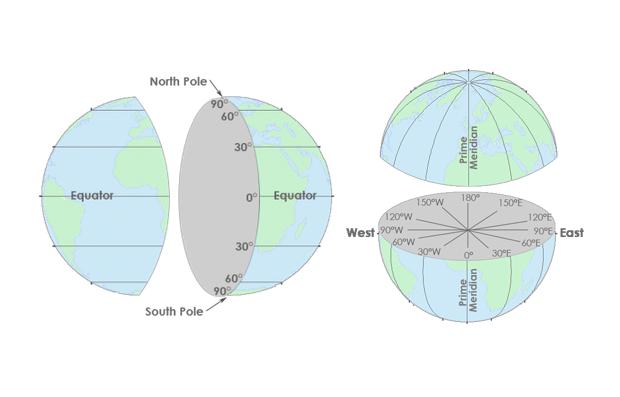
纬度线东西走向,平行,从 -90 度到 +90 度。经度线呈南北走向,汇聚于两极,范围为 -180 至 +180。
如果您需要地图投影类型的视觉参考指南,制图师使用的全球 50 大地图投影的金矿将有所帮助。
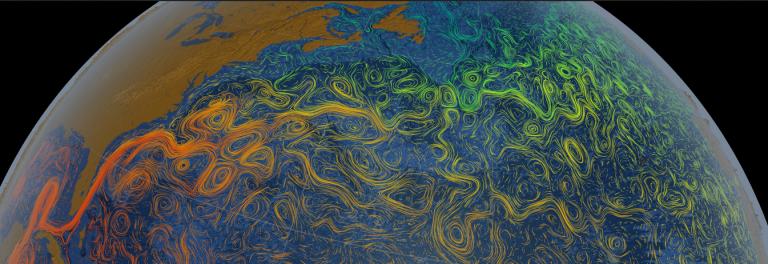
我们的海洋运动每天都会推动大量的水。但是哪里?查看此洋流地图列表并可视化我们的海洋运动和动态。
有多种方法可以帮助读者理解地图比例尺和距离。例如,制图师使用比例尺、定位器地图、规定比例尺和比率比例尺。
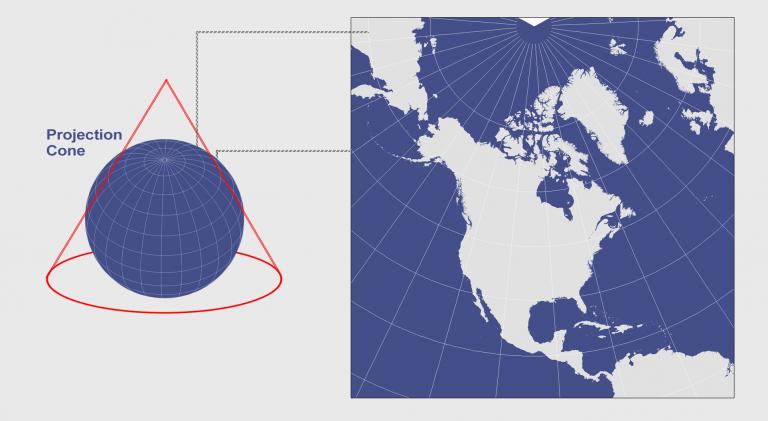
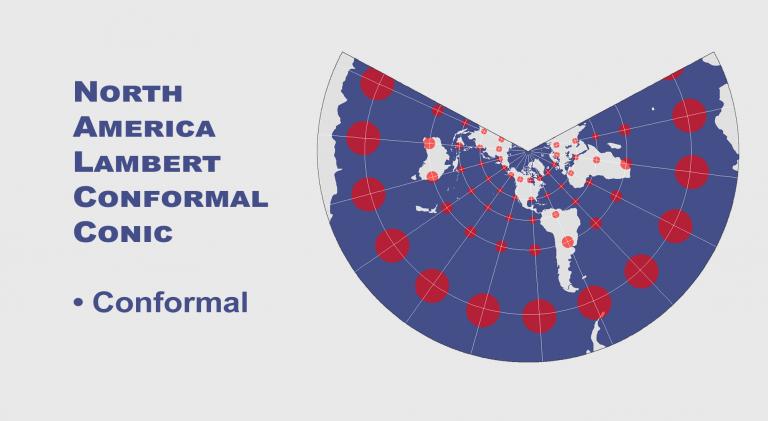
当您在地球上放置一个圆锥体并展开它时,会产生一个圆锥投影。例子有阿尔伯斯等面积圆锥曲线和兰伯特等角圆锥曲线。

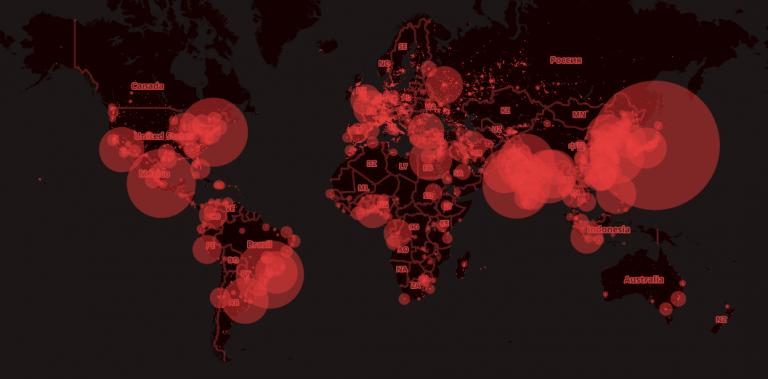
每天,社区都面临着传染性疾病和日益严重的流行病(如 COVID-19)的风险。我们使用 GIS 在实时地图中跟踪病毒的传播。
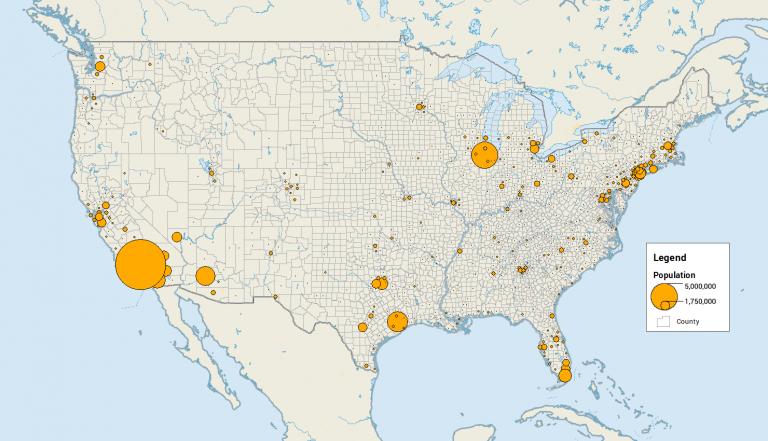
分级符号和比例符号根据值缩放符号的大小,而点分布图使用点来表示数量。
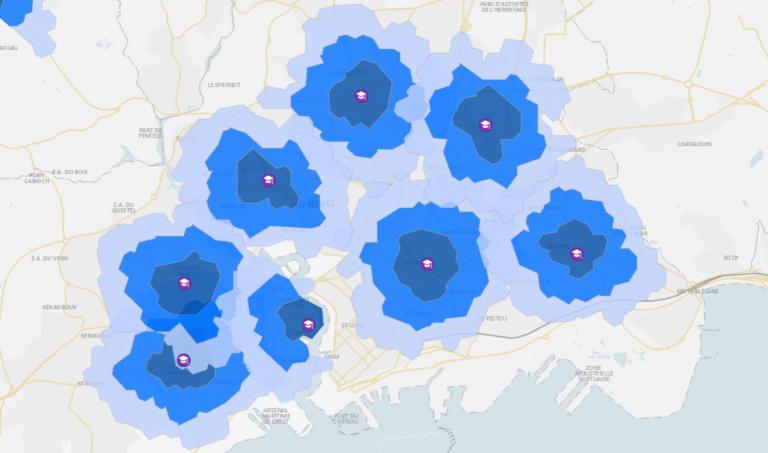
行驶时间图是一种等时线图,它根据起始位置和分配的时间向您显示可以行驶多远。
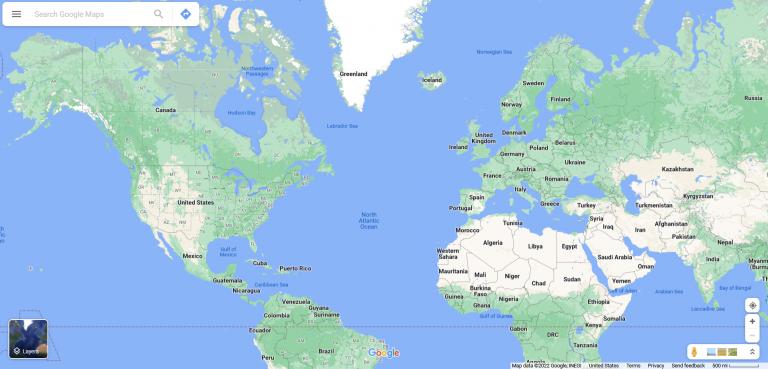
Web 墨卡托投影使用墨卡托投影的修改版本,并已成为 Web 制图的默认地图投影。
时空立方体展示了现象在地理空间内如何随时间变化。在时空立方体中,每个立方体代表一段时间。

地形学家面临着不断变化的地理环境的艰苦战斗。这些是为应对准确性和完整性挑战而构建的 10 大地形图。
从制图到等高线图,制图师就像英雄一样。每个英雄都有一个秘密。如果您想构建无与伦比的地图,这里有 25 种地图类型。
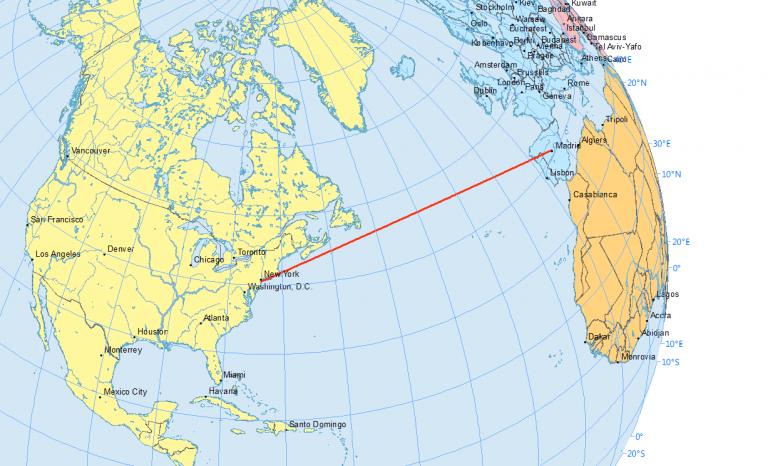
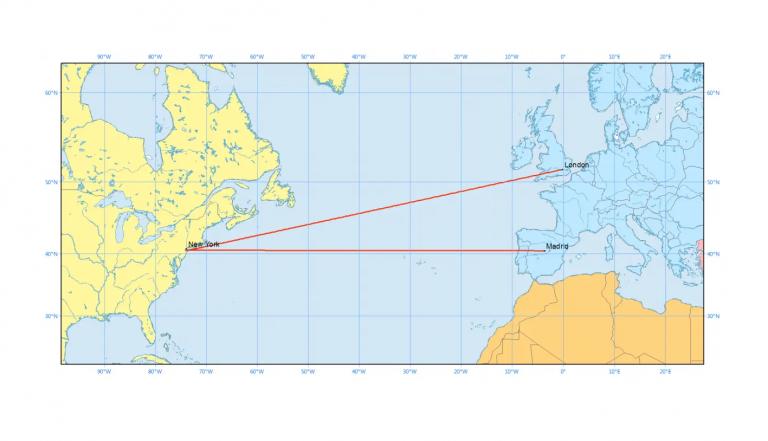
飞机在 3 维空间中沿着真正的最短路线飞行。这条弯曲的路线被称为测地线或大圆路线。
点状图使用点来显示一个区域中特定现象的密度。与较少的点相比,更多的点代表更高的密度。